

Price action instead of indicators
Indicators such as RSI or MACD are calculated from the price and therefore always lag behind it. Price action starts directly with the price: candles, highs and lows, and the reaction at important zones.
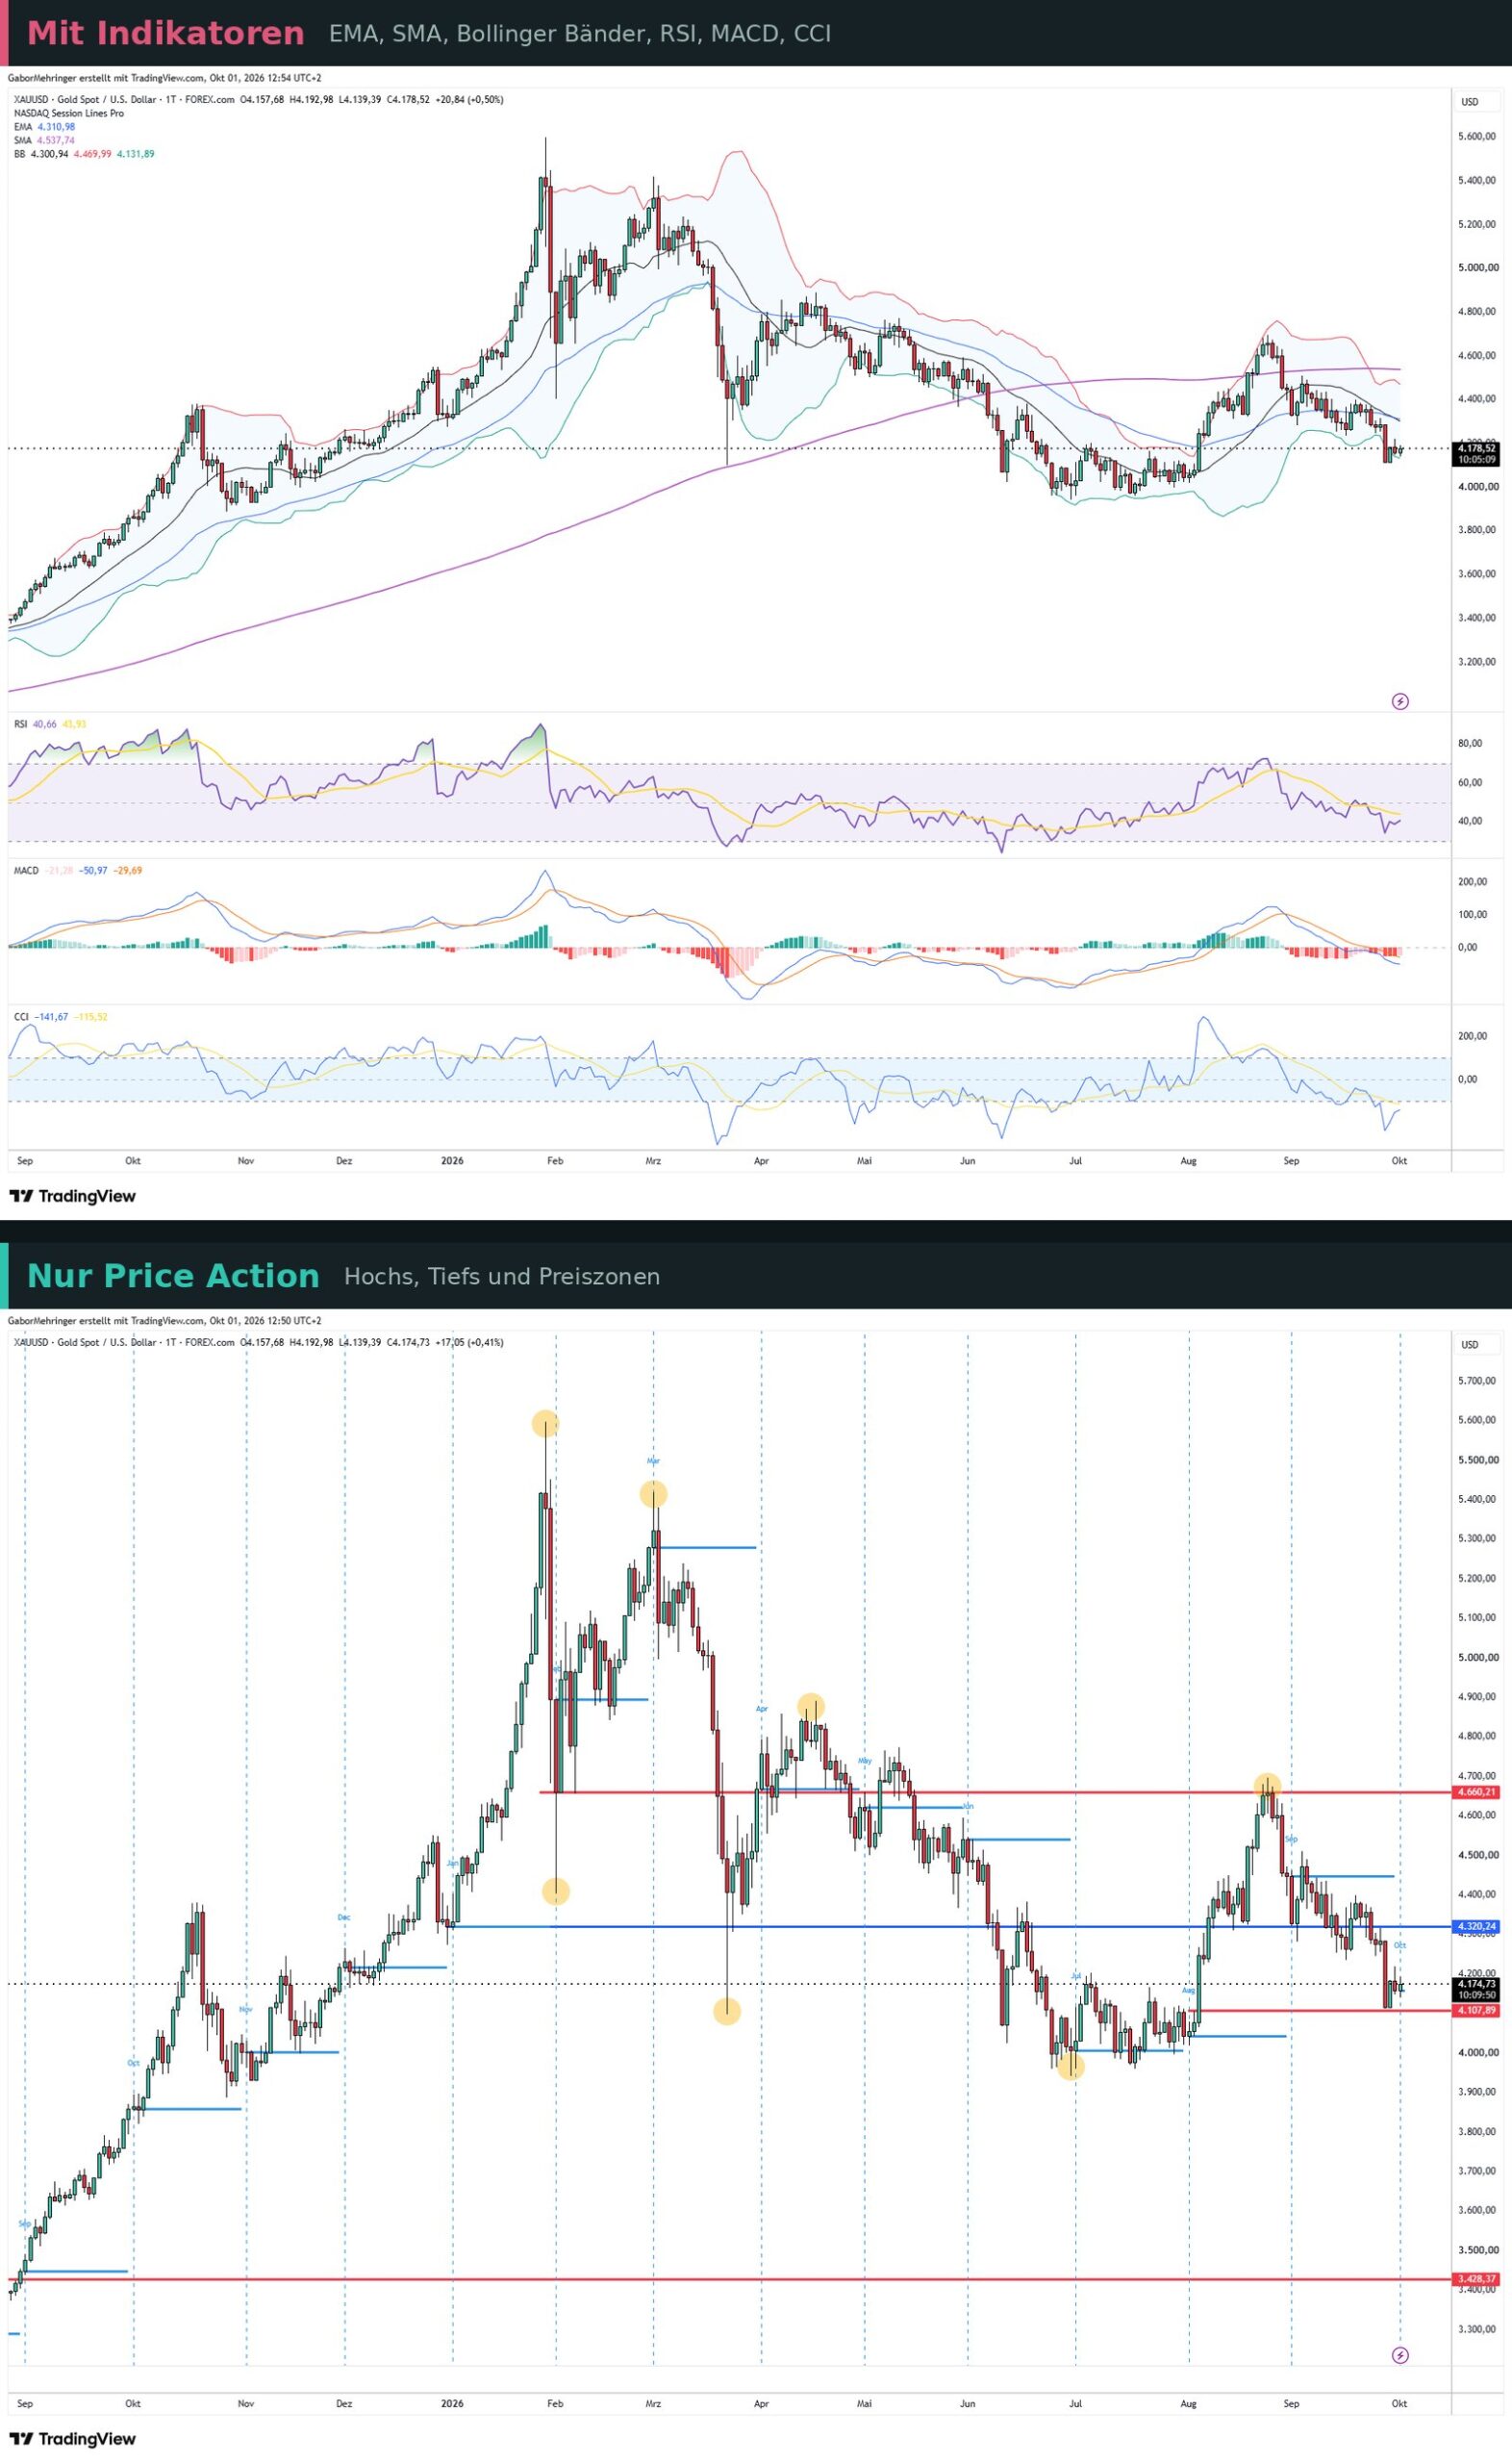
The advantage: your chart stays clear, and you learn to read the market yourself instead of relying on signals that other tools calculate for you.
Price action and Smart Money Concept (SMC)
Smart Money Concept, or SMC for short, is not the opposite of price action but a variant of it. Both read the pure price path and do without classic indicators. SMC gives the patterns their own names and puts one question at the centre: where is the liquidity, and where might the price go next to collect it?
The most important terms:
- Break of Structure (BOS) and Change of Character (CHoCH): the price breaks the market structure, either in the direction of the trend or against it.
- Liquidity sweep: the price briefly runs above a high or below a low and then turns.
- Fair Value Gap (FVG): a price gap after a fast move, to which the price often returns.
- Order block: the last opposite candle before a strong move.
Classic chart analysis knows much of this under other names: a liquidity sweep is a false breakout, a CHoCH a trend break, a demand zone a support. The terms are new; the price patterns behind them are not.
Important for context: what large market participants actually do cannot be read from the chart. SMC describes recurring price patterns, not confirmed order data. Take the concepts as tools for structuring the price path, not as a look behind the scenes.
The chart as a tool: futures chart and timeframes
For analysis I use the futures chart, because all market participants trade there on one central exchange. Prices and volume are therefore consistent and meaningful, even if you trade CFDs yourself.
The right timeframe is just as important: in day trading I work mainly with the 5-minute chart. For swing trading or position trading, hourly, daily and weekly charts are used. The higher timeframe sets the direction.
Reading candlestick charts: anatomy and patterns
A candlestick chart shows four prices for each period: open, high, low and close. On the 5-minute chart each candle stands for five minutes of trading, on the hourly chart for one hour.
- Body: the area between the opening and closing price. If the candle closes above its open, it is green (rising). If it closes below, it is red (falling).
- Upper and lower wick: the thin lines above and below the body. They show how far the price moved up and down during the period before it came back.
What the shape tells you: A large body shows that one side clearly dominated the period. A small body with long wicks shows indecision. A long upper wick means higher prices were sold off. A long lower wick means lower prices were bought.
A single candle is not a signal yet. It only becomes meaningful at the right place on the chart, for example at a session line or at support.
Five well-known candlestick patterns and when they really count
Candlestick patterns are often misread. The shape alone is not enough: what matters is what happened before and where on the chart the candle forms.
- Doji: open and close are at almost the same price; the body is just a line. A doji shows indecision and on its own says nothing about direction. It becomes interesting after a strong move at an important level.
- Hammer: small body at the top, long lower wick, hardly any upper wick. A hammer only counts as a reversal pattern if it is preceded by a downtrend and the candle tests new lows of the last periods. The same shape in the middle of a sideways phase is not a hammer, just a candle with a long lower wick.
- Shooting star: the counterpart to the hammer. Small body at the bottom, long upper wick. It only counts after an uptrend and if the candle tests new highs of the last periods.
- Bullish engulfing: after falling prices, the body of a green candle completely engulfs the body of the red candle before it. The buyers have overrun the sellers of the previous period. Without a preceding downtrend, the pattern means nothing.
- Bearish engulfing: the counterpart. After rising prices, the body of a red candle completely engulfs the body of the green candle before it.
For all five: the pattern is a hint, not an entry signal. I look at whether it forms at a session line, a support or a resistance, and whether the next candle confirms it.
Market structure: trend or sideways market?
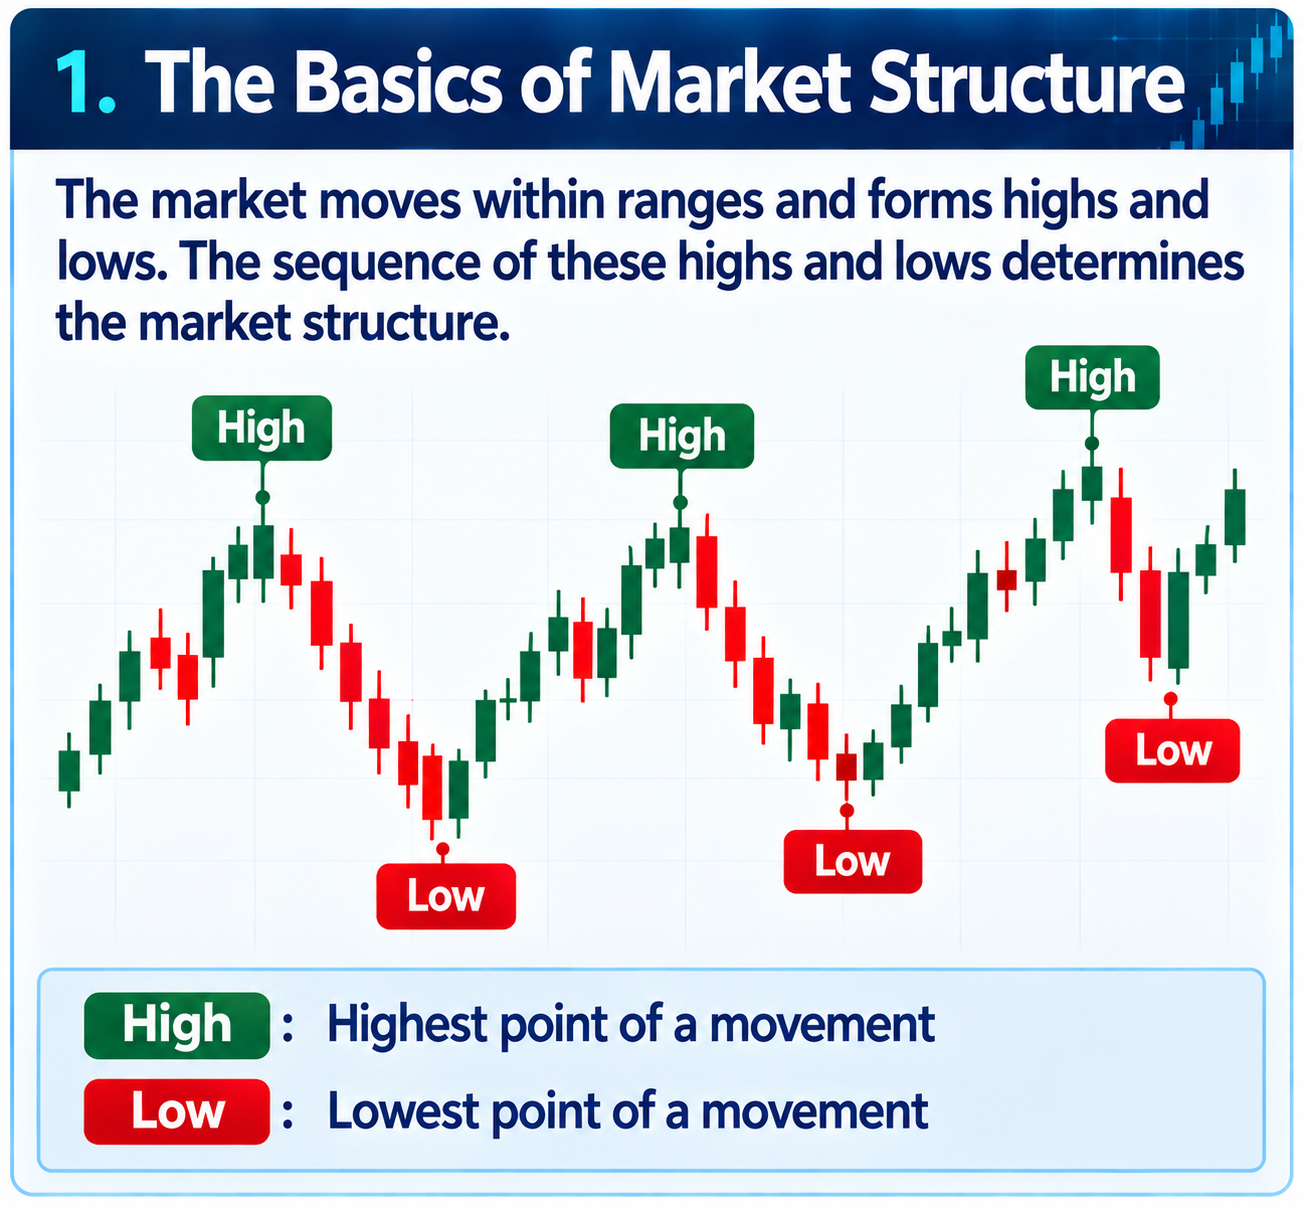
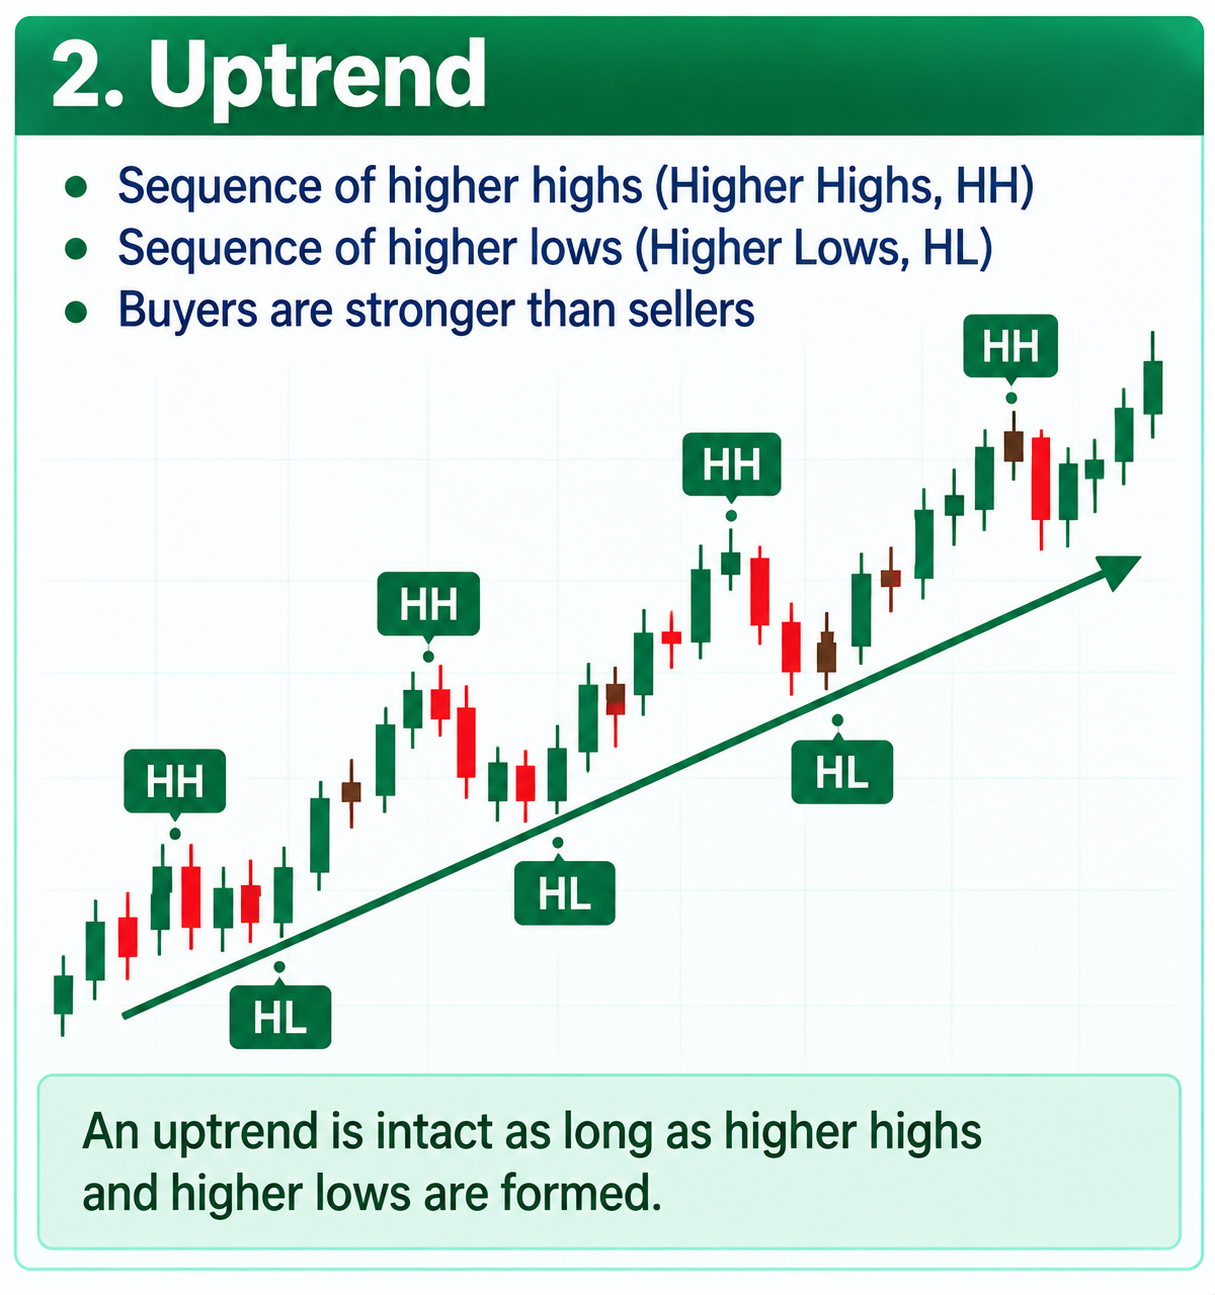
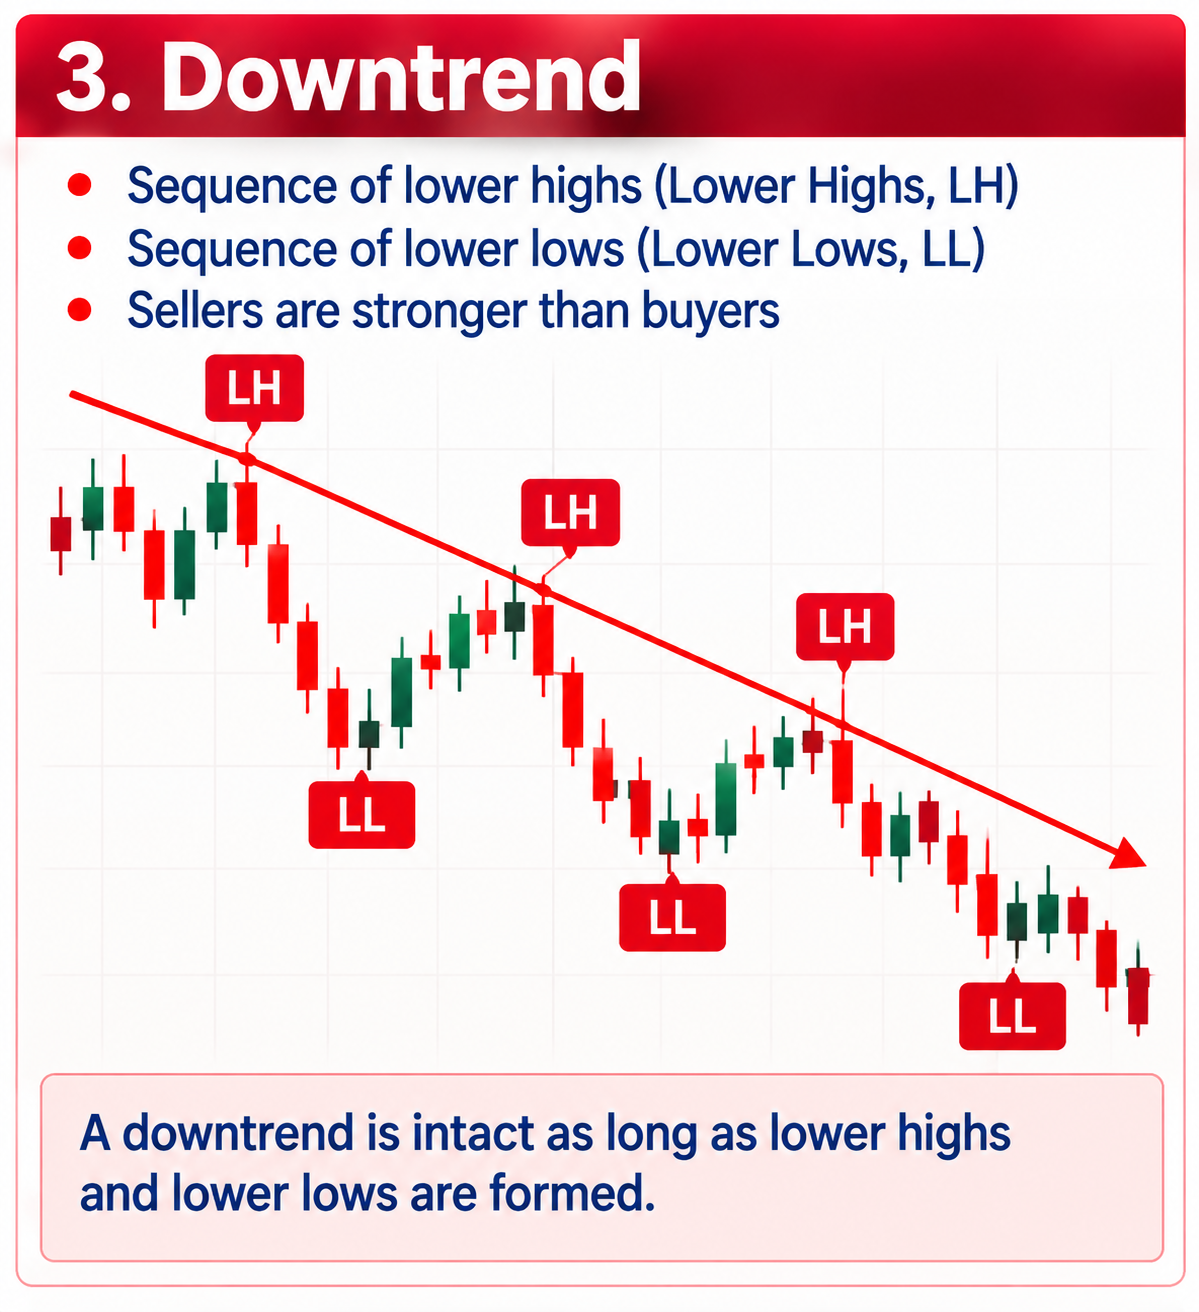
Before you plan a trade, you need to know which phase the market is in. An uptrend shows higher highs and higher lows, a downtrend lower highs and lower lows.
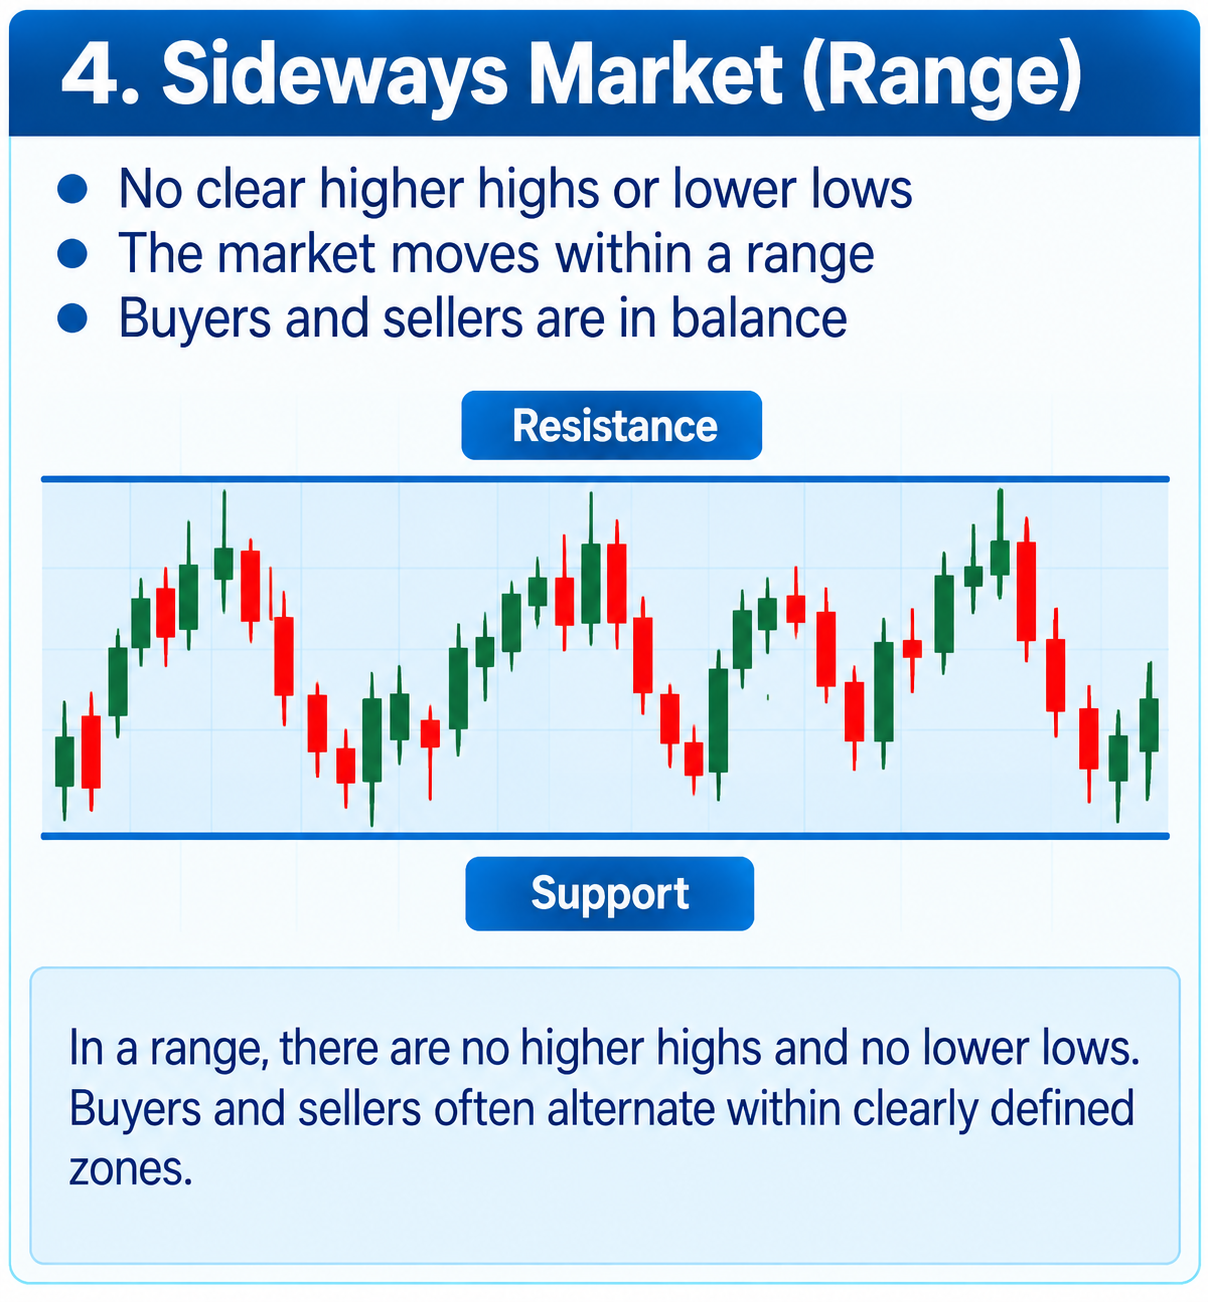
If there is no clear direction, the price swings sideways between support and resistance. Trend following works in a trend; in a range, other approaches are needed. If you misjudge the structure, you are fighting the market.
Support, resistance and supply/demand zones
Supports are areas where buyers have so far been strong enough to stop the price. Resistances are the counterpart on the sellers’ side. In practice these are rarely exact lines, but zones.
Supply and demand zones mark areas the price previously moved away from strongly. These areas can act as reaction zones when the price returns to them. A frequently observed pattern is the role reversal: broken resistance becomes support and vice versa.
My day trading chart: daily open and session lines
My chart is deliberately simple: a naked candlestick chart with a few reference lines. The most important is the daily open, plus the opening prices at fixed times: 08:00, 10:00, 14:00 and 15:30 (CET/CEST). In the weeks when the USA and Europe change their clocks on different dates (in March and at the end of October), Wall Street opens at 14:30 Vienna time.
These times mark typical phases of the trading day, from European pre-market trading to the opening of Wall Street. Whether the price is above or below these lines gives me clear guidance on direction.
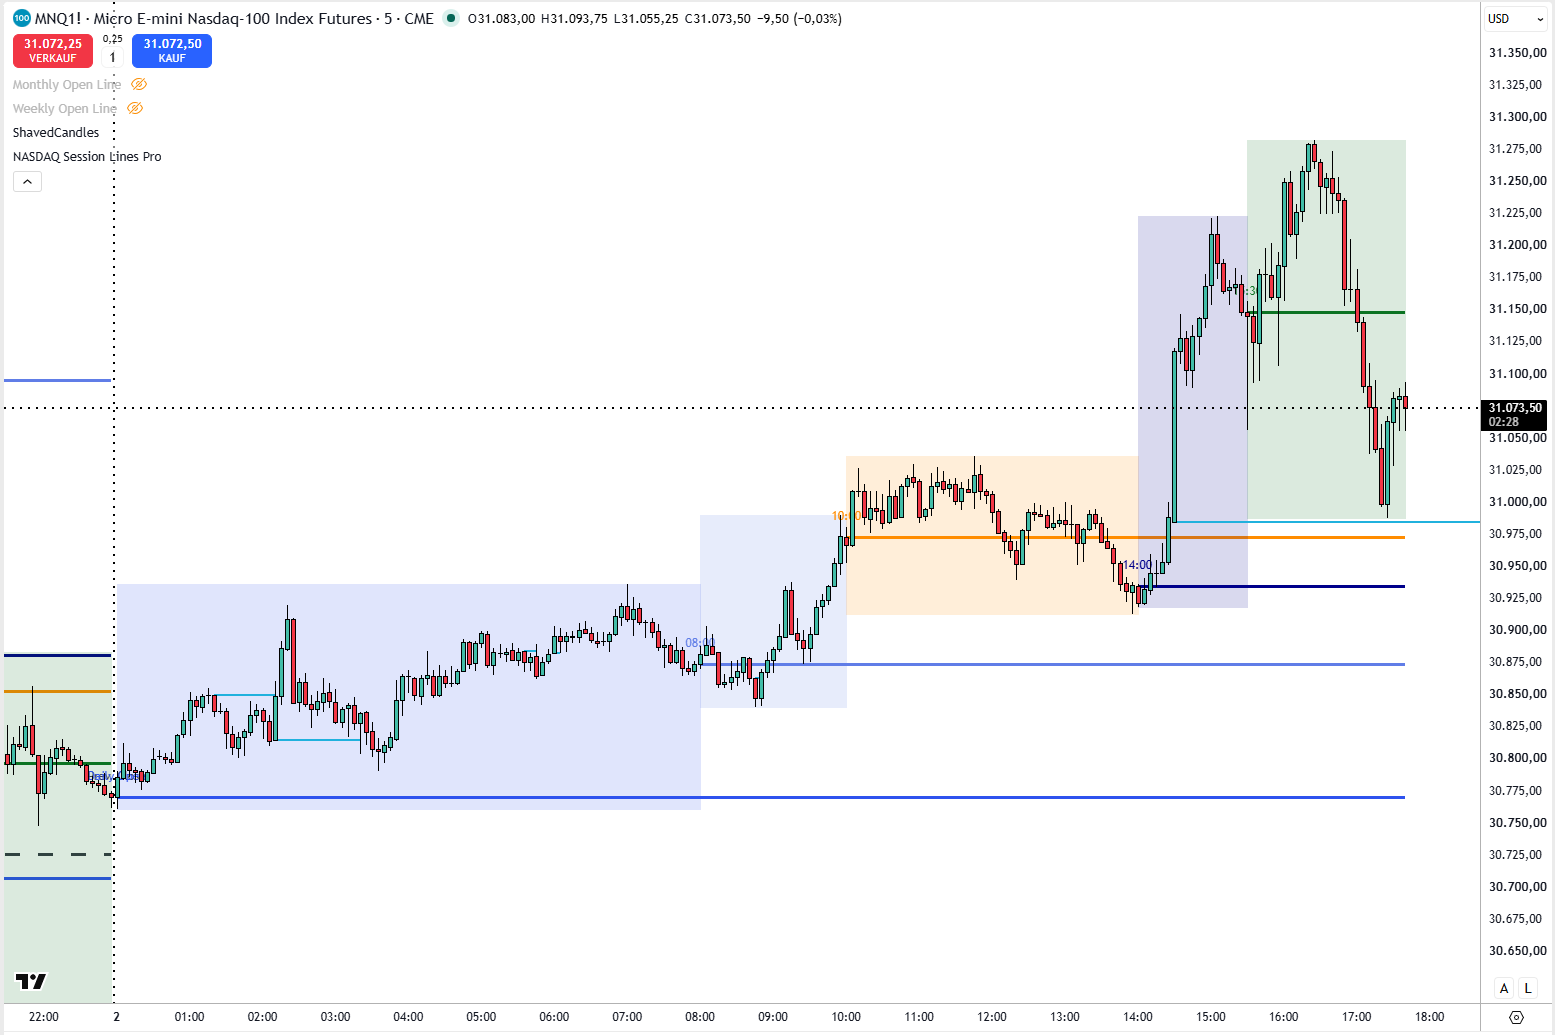
Illustration, not real price data.
Price gaps: opening gaps and fair value gaps
An opening gap occurs when the market opens well above or below the previous day’s close. Many of these gaps are closed fully or partly during the day, but not all. That is exactly what makes them interesting.
A fair value gap is a gap within a strong move: between the high of the first and the low of the third candle, an area remains without overlap. Such zones are often revisited later and serve as possible reaction areas.
Risk management: position size, stop-loss and pyramiding
The best analysis is worthless without risk management. The basis is a fixed risk per trade, for example 1 % of the account. From this you calculate your position size: risk ÷ (stop distance × point value).
The stop-loss belongs where your trade idea becomes invalid, not where it happens to feel good. Advanced techniques such as scaling in, scaling out or pyramiding, i.e. adding to a winning position, help you let profits run while keeping the risk under control.