
If you trade the Nasdaq E-mini, you are trading against machines. Around three quarters of the volume in this contract comes from automated systems. In this article I show you how this came about, who is behind the algorithms, what research says about their influence and what it means for you as a day trader.
A contract that never saw a trading floor
The E-mini Nasdaq-100 future (ticker NQ) was launched on the Chicago Mercantile Exchange on 21 June 1999, in the middle of the euphoria of the dotcom bubble. Unlike the big contracts before it, it was not traded in the pit by open outcry but electronically on the Globex platform from the start. That made it tailor-made for computer programs: every price, every order and every execution exists in digital form.
In the early years, a few thousand contracts changed hands each day. In 2024 the CME reported more than 600,000 contracts a day with a value of over 230 billion US dollars. Since 2019 there has also been the Micro E-mini at one tenth of the size. In 2025 it reached a record average of 1.6 million contracts a day.
How large the share of algorithms is
The US regulator CFTC has analysed what share of volume comes from automated systems. For the E-mini Nasdaq-100 it was around 77 % in the period November 2014 to October 2016 and around 74 % from November 2016 to October 2018. Across all equity index futures the share was most recently around 74 %. I have not found more recent official figures for this contract. It is unlikely that the share has fallen since then.
The CFTC also describes how automated orders can be recognised: they are smaller than manual ones, stay in the order book for a shorter time and are almost always limit orders.
Who is behind the algorithms
There is no such thing as “the algos”. They are different groups with different goals:
- Market makers: They constantly quote buy and sell prices and earn the spread in between. They hold their positions for only seconds to minutes.
- High-frequency traders: They react within microseconds to changes in the order book and in related markets.
- Arbitrage programs: They keep the future in step with the Nasdaq-100 index, with ETFs such as the QQQ and with the S&P 500 future. If a price deviates, the gap is traded immediately.
- Execution algorithms: Large funds split their orders into many small pieces and spread them over hours, for example along the volume-weighted average price (VWAP).
- Trend followers and risk models: Systematic funds buy and sell according to fixed rules, for example depending on trend and volatility.
- Options hedging: Traders who have sold options continuously hedge their risk via the future. This too runs automatically.
The race for microseconds
Since 2010, Globex’s central matching engine has been located in a data centre in Aurora, around 50 kilometres west of Chicago. Trading firms rent space there right next to the exchange so that they can transmit their orders as quickly as possible. Even from downtown Chicago, a signal needs at least 287 microseconds one way over fibre optics. Since 2012, microwave links have connected Aurora with the data centres of the stock exchanges in New Jersey, because radio through the air is faster than light in a fibre-optic cable.
For you as a private trader, this means: you cannot win the race for speed, and you do not have to.
The 2010 flash crash as a lesson
On 6 May 2010 it became clear what happens when algorithms collide. A fund had an automated program sell 75,000 E-mini contracts on the S&P 500 worth around 4.1 billion US dollars. The future fell 5.1 % in 13 minutes and recovered over the following 23 minutes. The Nasdaq future moved with it.
The study by Kirilenko and colleagues came to a nuanced conclusion: high-frequency traders did not trigger the crash, but they amplified it. On that day, 16 accounts accounted for around 29 % of volume. They held hardly any inventory and passed the contracts among themselves. In 14 seconds they traded over 27,000 contracts while their net position changed by only around 200 contracts. So a lot of turnover does not automatically mean a lot of liquidity. More on this in the article on the black swan in the stock market.
Do algorithms make the market more volatile?
The data says no, at least on a daily basis. According to the CFTC, the share of automated orders rose every year from 2013 to 2018, but the fluctuations in closing prices did not follow this trend. In quiet phases, algorithms have made the market tighter and deeper: the spread between bid and ask in the NQ is usually just one tick.
The downside shows in stress phases. Market makers are not obliged to stay in the market. Before important data and on surprising news they pull their orders, the order book thins out and the price jumps.
What this means for you as a day trader
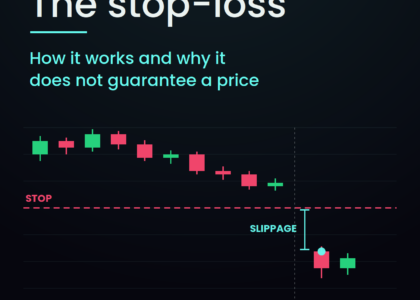
- Expect slippage around news: When liquidity disappears, your stop is executed at the next available price, not at the price you wanted.
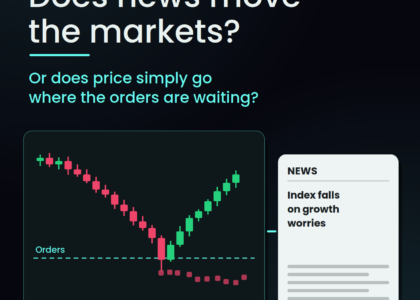
- Obvious levels attract orders: There are many stops above daily highs and below daily lows. That is where the liquidity is, and the price often runs into these zones before it turns.
- Trade when the market is deep: Around the US open at 15:30 (Vienna time) most of the volume is in the market. At night, smaller orders are enough for bigger moves.
- Use your advantage: You do not have to move billions and you can wait. Your timeframe is minutes and hours, not microseconds.
- Adjust the position size: With the Micro E-mini you can fine-tune your risk per trade.
Assessment: In the Nasdaq future, algorithms are not the opponent but the environment. On normal days they ensure tight spreads and fast execution, and they are the reason why the market moves faster than it used to in exceptional situations.
Sources: CME Group, “The Growth of Tech and 25 Years of Nasdaq Futures” (July 2024) and annual trading volume report 2025; CFTC, “Automated Trading in Futures Markets – Update #2” (2019) and “Impact of Automated Orders in Futures Markets” (2019); Kirilenko, Kyle, Samadi, Tuzun, “The Flash Crash: The Impact of High Frequency Trading on an Electronic Market”; Databento, “Where is the CME matching engine located?”.
This article is for financial education and does not constitute individual investment advice or a trading recommendation.
Best wishes
Gabor