



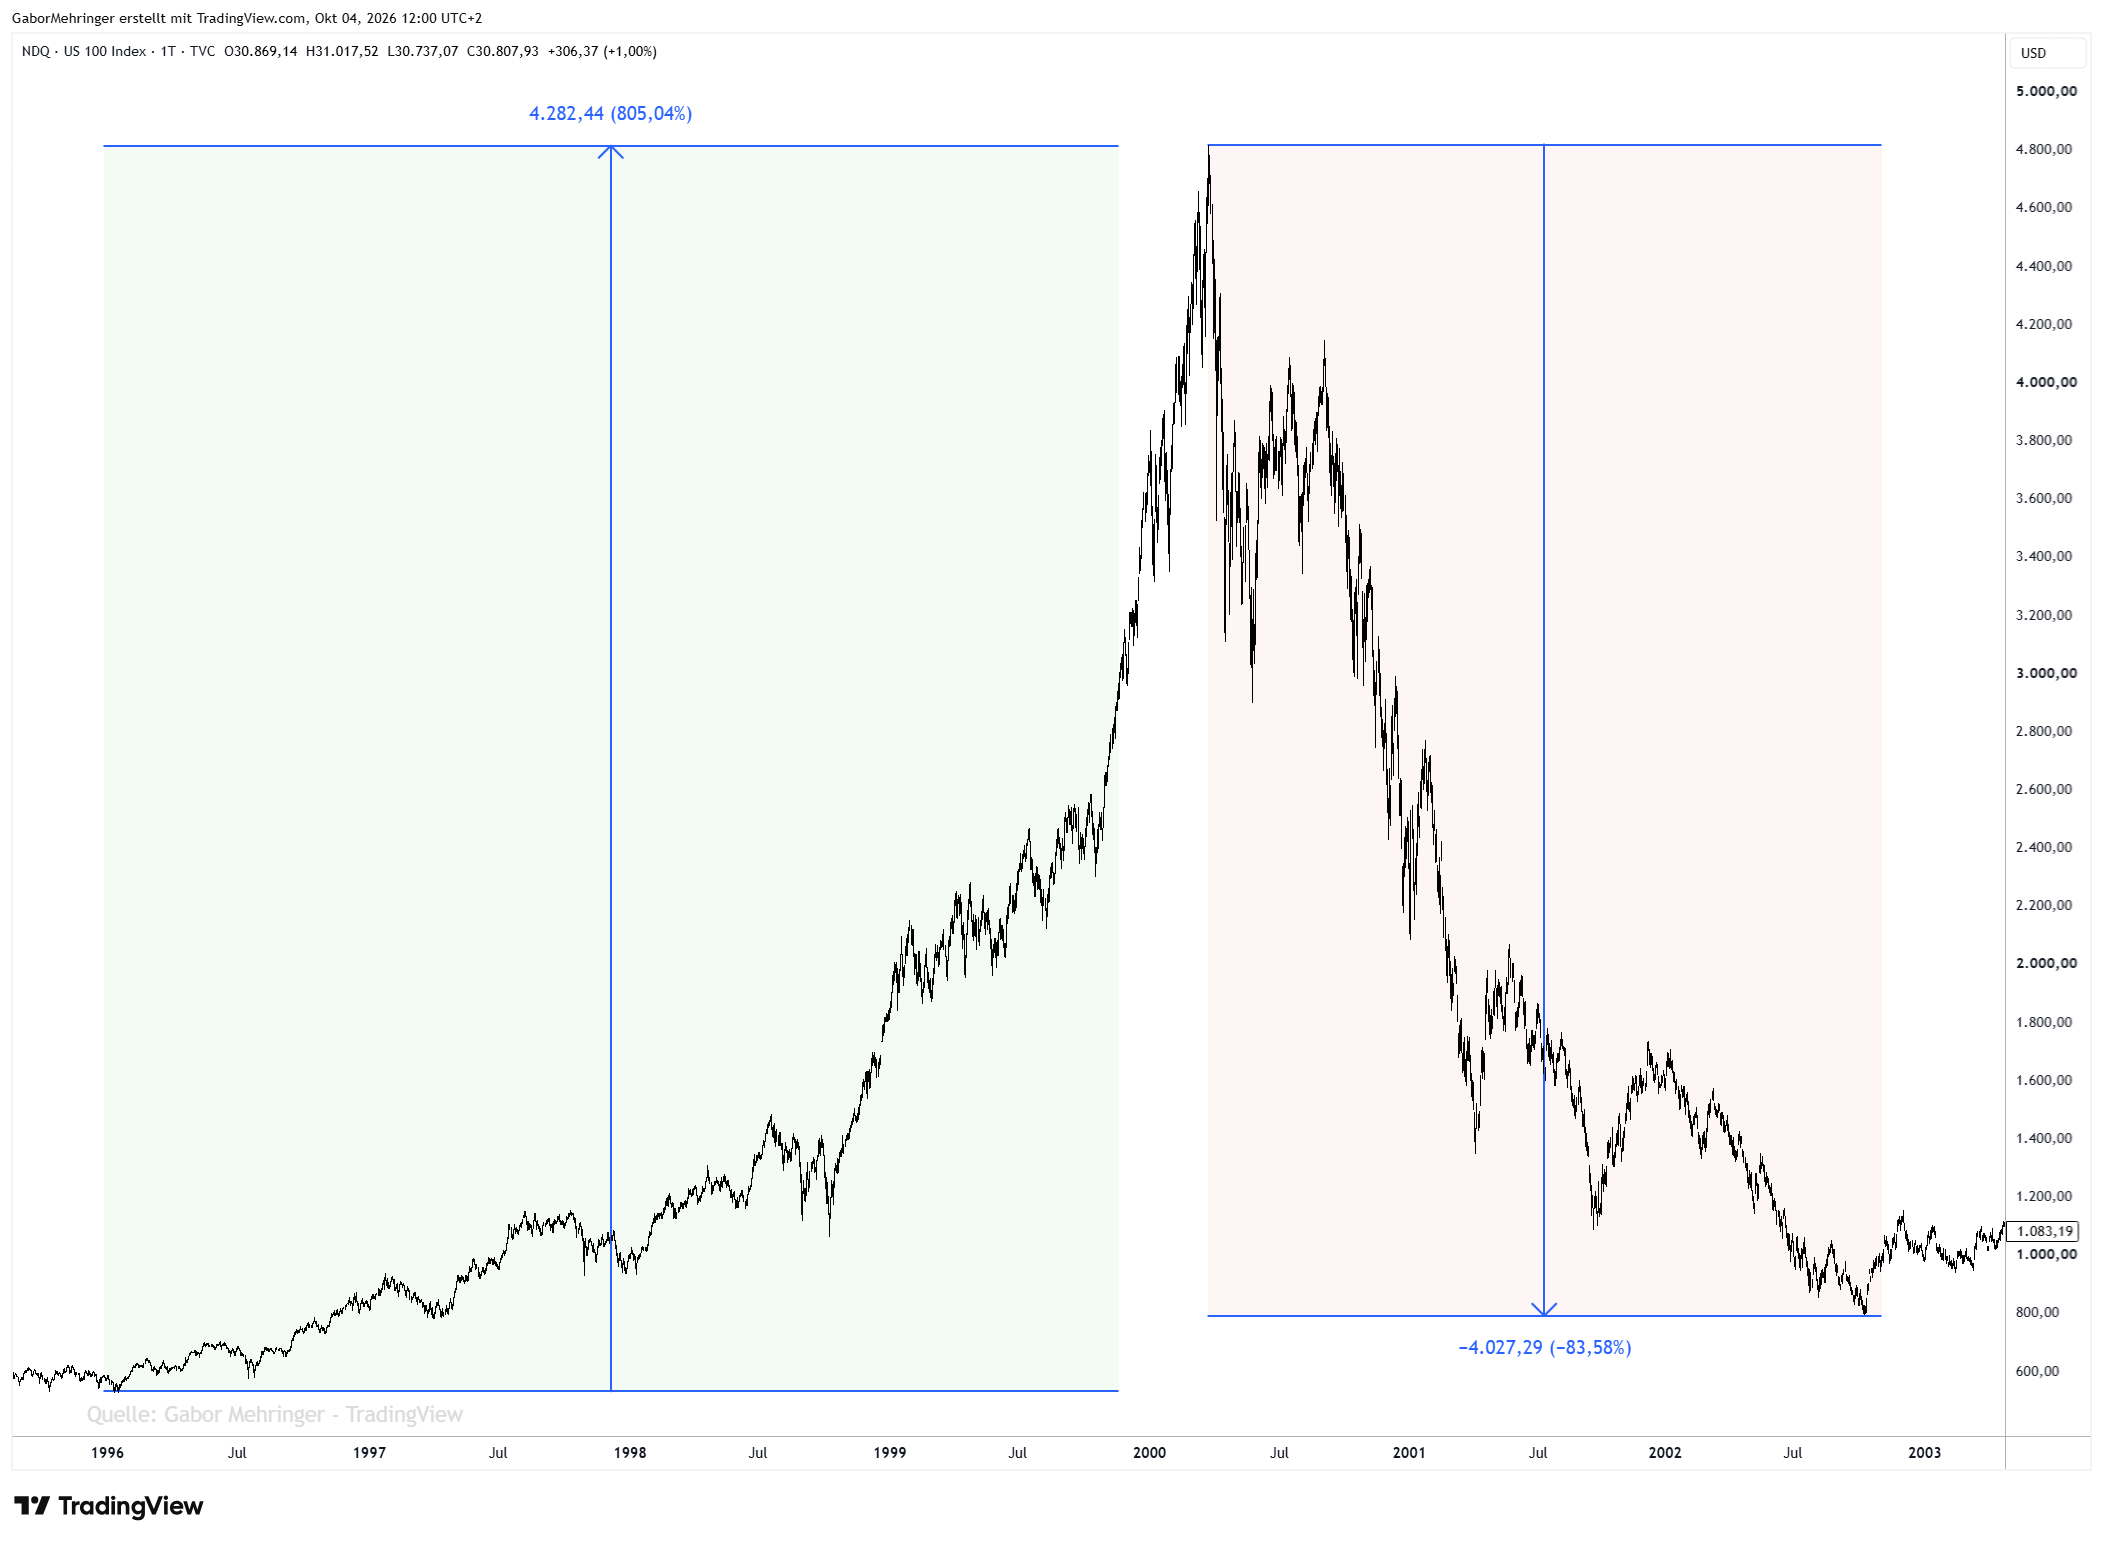
The bursting of the dotcom bubble between March 2000 and October 2002 was not a flash crash lasting a few minutes, but an agonisingly long, fundamental collapse. At its worst, the tech-heavy Nasdaq Composite lost around 78 % of its value, and the Nasdaq 100 even more than 80 %. Around five trillion US dollars of market value were wiped out.
The context: “irrational exuberance” and a new era
The phrase “irrational exuberance” comes from Alan Greenspan, then chairman of the US Federal Reserve. In December 1996 he used it to describe enthusiasm in the markets that could no longer be justified by economic facts: prices rise because everyone expects them to keep rising.
- The big promise: In the mid-1990s the World Wide Web reached the mass market. Many investors believed in a “new economy” in which old valuation yardsticks such as earnings, cash flow or the price-to-earnings ratio (P/E) no longer applied.
- Metrics far removed from reality: Unprofitable start-ups were valued by how many website visitors (“eyeballs”) they attracted. An IPO with the suffix “.com” often doubled the share price on the first trading day.
- The peak of euphoria: Between 1995 and March 2000 the Nasdaq Composite rose fivefold, from around 1,000 to over 5,000 points. The index’s average P/E was in triple digits at the time.
The fuse: what triggered the turn
- Fed rate hikes: To slow the economy and speculation, the US Federal Reserve under Alan Greenspan raised its key rate in six steps from 4.75 % to 6.50 % between June 1999 and May 2000. Cheap risk capital began to dry up.
- The Barron’s article: On 20 March 2000 the financial magazine Barron’s published the cover story “Burning Up”. The analysis showed that around a quarter of the internet companies examined would run out of money within twelve months unless they raised fresh capital.
- The Microsoft ruling: In early April 2000 a US federal judge ruled in the antitrust case that Microsoft had violated competition law. This was a blow to one of the leading stocks of the technology sector and weighed on sentiment on the Nasdaq.
How the bear market unfolded (March 2000 to October 2002)
- 10 March 2000, the peak: The Nasdaq Composite marks its intraday high at 5,132.52 points and closes at 5,048.62. It would not reach this level again for around 15 years.
- Spring 2000, the first slump: Within a few weeks the Nasdaq loses around a third. Many recent IPOs collapse by 50 to 80 %, but many market participants still see the setback as an ordinary correction.
- Autumn 2000 to spring 2001, the wave of bankruptcies: Because the capital market remains closed for follow-on financing, many well-known start-ups go bankrupt. The slump spreads to network equipment makers such as Cisco, Lucent and Nortel, whose customers cancel orders on a large scale.
- September 2001, the geopolitical shock: The terrorist attacks of 11 September hit a market that was already weakened. By then, the US economy was already in recession.
- October 2002, the low: After two and a half years of bear market, the Nasdaq Composite closes at 1,114.11 points on 9 October 2002, around 78 % below its peak.
Icons and absurdities of the bubble
- Pets.com: Regarded as the epitome of excess. The company spent millions on a Super Bowl commercial, sold heavy pet food below cost with free delivery and went bankrupt only around nine months after its IPO.
- Cisco Systems: In March 2000, with a market value of over 550 billion US dollars, Cisco was briefly the most valuable company in the world. The share lost almost 90 % in the crash.
- Amazon: The share fell by over 90 % between December 1999 and autumn 2001, from around 106 to under 6 US dollars (prices at the time). The company survived the period partly thanks to convertible bonds issued in good time.
- Germany’s Neuer Markt: On the Neuer Markt, founded in 1997, the Nemax 50 selection index lost more than 95 % from its high of over 9,600 points in March 2000 until it was discontinued. Scandals and accounting fraud, including at Comroad, shook German retail investors’ confidence in shares for years.
The long-term consequences
- A return to hard fundamentals: Valuations once again focused on free cash flow, operating margins and viable business models.
- Stricter accounting rules: The accounting scandals at Enron and WorldCom uncovered at the same time led to the Sarbanes-Oxley Act in 2002, which significantly tightened executives’ liability for financial reports.
- The rate cycle and the next bubble: To cushion the consequences, the Fed cut its key rate to as low as 1.0 %. For many, this long period of low interest rates is one of the causes of the next boom and crash, the housing and subprime crisis of 2007/2008.
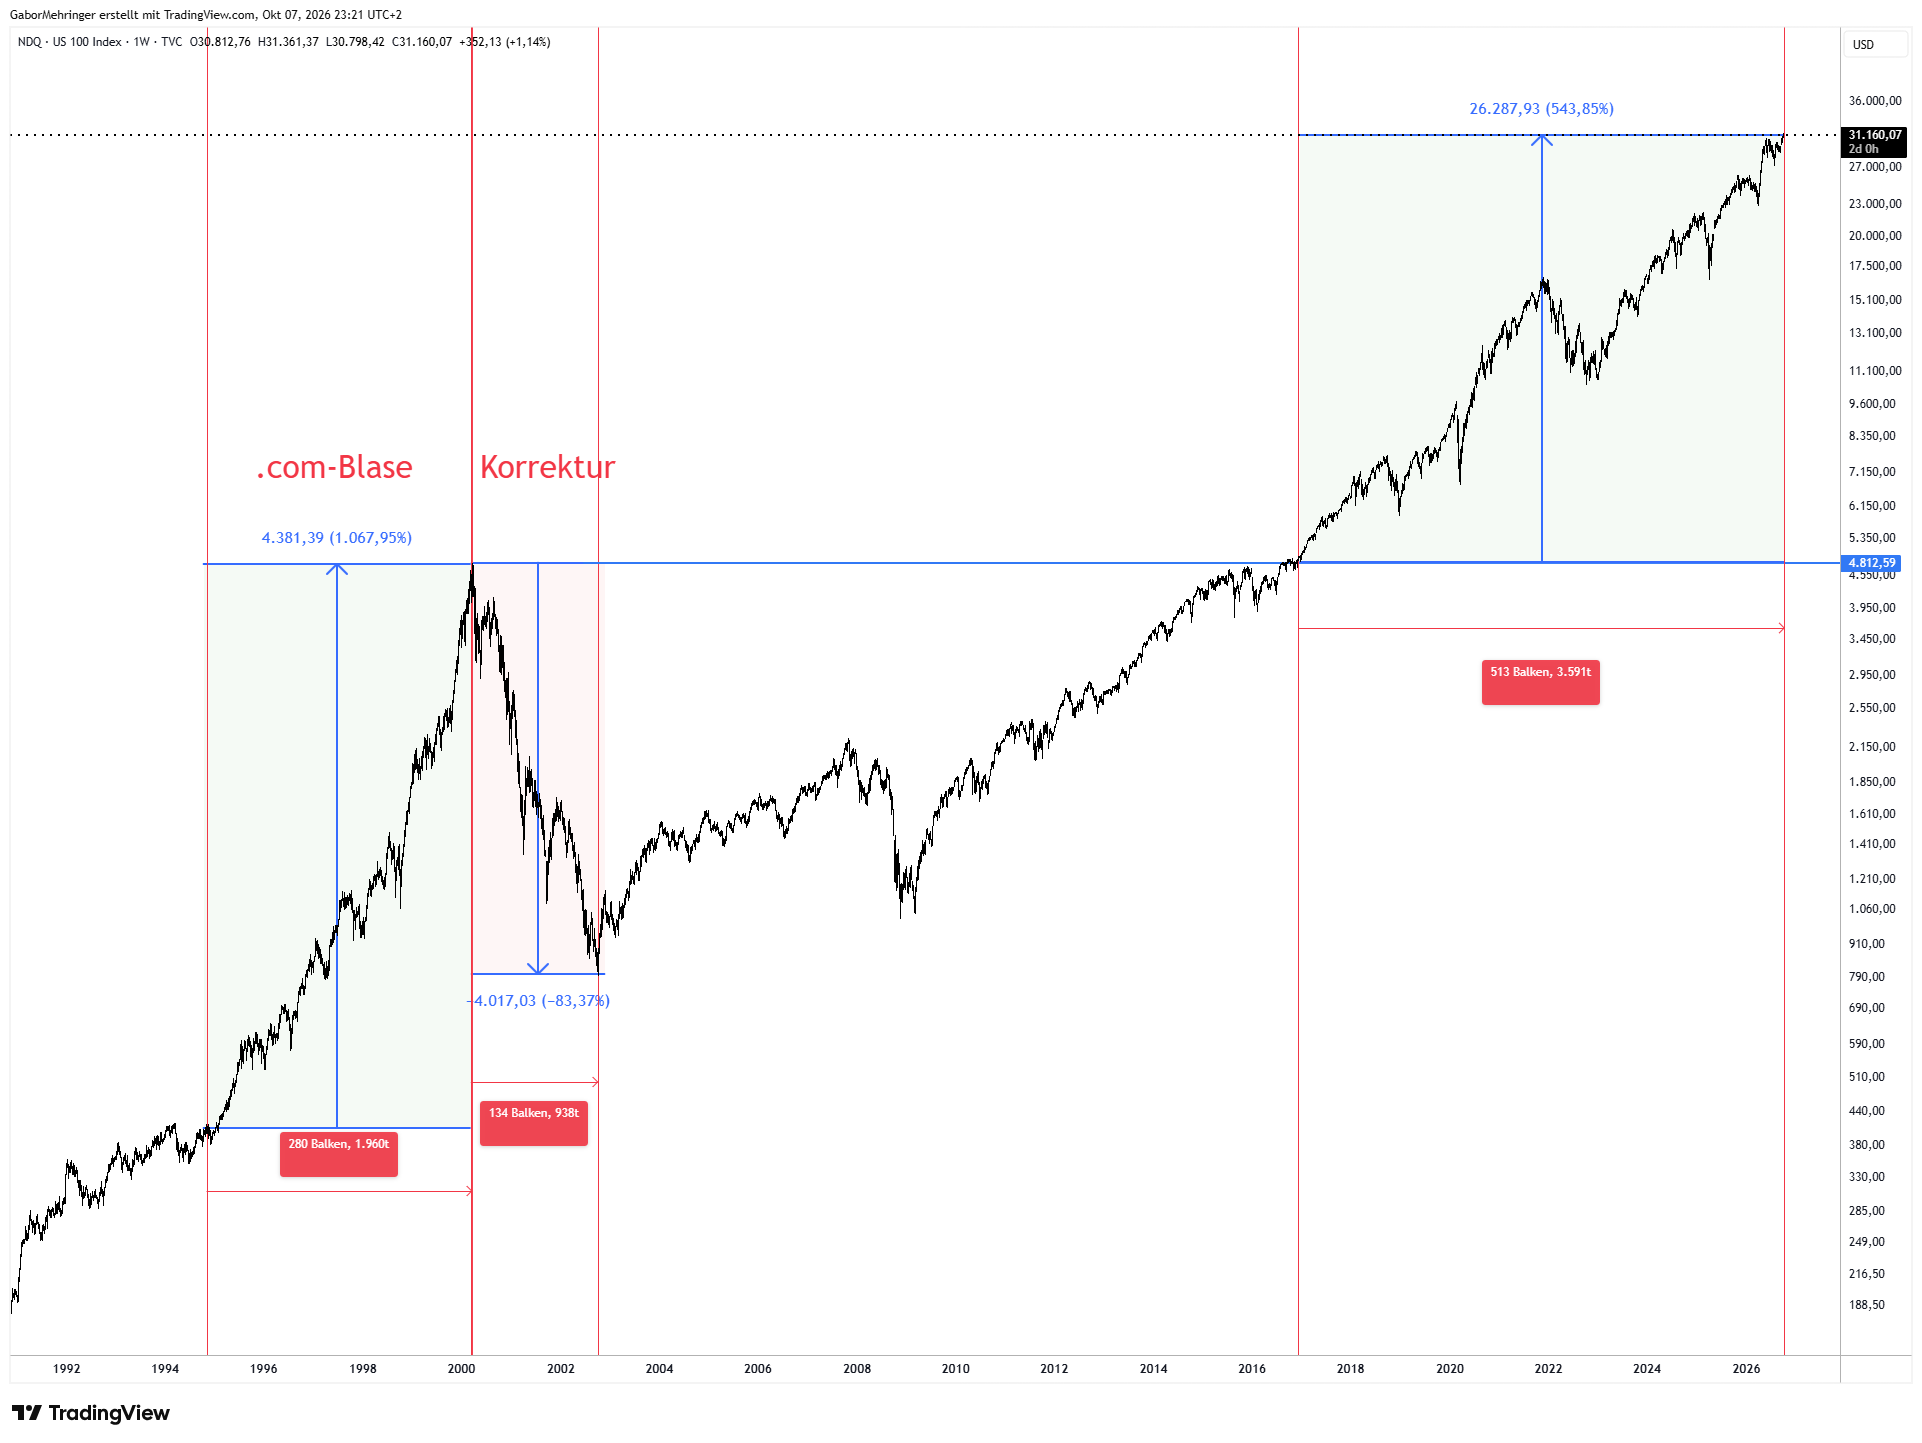
- 15 years to the old high: The Nasdaq Composite needed until April 2015 to regain its March 2000 high. That is a reminder of what it means to bet one-sidedly on a hyped sector.
Parallels with today: the AI boom
More than 25 years later, the dotcom bubble is often cited again, this time in connection with artificial intelligence. Whether the AI boom is a bubble can only be said in hindsight. But some parallels are striking, and so are some differences.
What is reminiscent of the years around 2000:
- A new technology and a big story: Back then it was the internet; today it is artificial intelligence. In both cases the technology is real, and in both cases people say the old yardsticks no longer apply.
- Huge investments up front: Around 2000 the money flowed into fibre-optic networks and network technology. Today it flows into data centres and chips. Microsoft, Alphabet, Amazon and Meta have announced combined investments of around 720 to 745 billion US dollars for 2026, after around 410 billion in 2025.
- High valuations: The Shiller P/E of the S&P 500 stood at around 41 at the beginning of October 2026. It has been higher only once, at the peak of the dotcom bubble at around 44.
- A few stocks carry the market: In summer 2026 the ten largest companies accounted for around 38 % of the S&P 500; at the end of 2025 it was even around 41 %. At the peak in 2000 it was around 26 to 27 %.
- An equipment supplier as the leading stock: Back then it was Cisco, which supplied the technology for the internet. Today it is Nvidia with the chips for the data centres.
What is different:
- The market leaders make money: Many dotcom companies had neither profits nor a viable business model. Today’s big technology groups are highly profitable. At its peak, Cisco was valued at around 200 times expected earnings. Nvidia is far from that, because its earnings have grown along with its share price.
- The sector is valued more cheaply than back then: The forward P/E of the technology sector was around 30 in spring 2026, compared with around 50 at the dotcom peak.
The open question: Investments of several hundred billion are so far matched by comparatively small revenues at the pure AI providers; estimates for 2026 are below 35 billion US dollars. Nobody knows today whether income will grow quickly enough.
I believe two lessons from the dotcom era can be applied today. First: a technology can succeed and investors can still lose a lot of money. The internet changed the world, and Amazon survived, but its share lost over 90 % first. Second: the timing cannot be determined. Greenspan warned of “irrational exuberance” at the end of 1996; the peak only came in March 2000.
Figures on the AI boom: Shiller P/E according to GuruFocus (as of 1 October 2026), investments according to Yield Theory and Value Add VC (as of October and August 2026), market concentration according to Walnut (as of July 2026), revenue estimate according to Futurum Group (February 2026), technology sector valuations according to The Next Web (April 2026).
Assessment: More the bursting of a recognisable speculative bubble than a black swan in the strict sense.
Lesson: A convincing story about the future is no substitute for a sound economic foundation.
This article is for financial education and does not constitute individual investment advice or a trading recommendation.
Best wishes
Gabor