
Why extreme surprises shake the markets and what traders can learn from them
A quiet trading day. Prices are moving in familiar ways and the risk seems manageable. Then comes a piece of news that hardly anyone expected. Buyers pull their orders, prices jump, and a seemingly controlled position turns into a substantial loss in no time.
On the stock market, situations like this are often called a “black swan”. But there is more to the term than a violent price crash. It describes the limits of our expectations – and the danger of confusing those expectations with certainty.
What is a black swan?
Former trader and author Nassim Nicholas Taleb made the term famous with his book “The Black Swan”, published in 2007. Three characteristics are central:
- The event lies outside the usual expectations. From the point of view of those affected, past experience gives hardly any indication of this possibility.
- It has an exceptionally large impact. In the financial markets this can mean drastic price moves, liquidity problems or a chain reaction in the financial system.
- In hindsight it seems explainable. Once it has happened, we find a story that makes the event seem more predictable than it actually was beforehand.
The metaphor is simple: anyone who has only ever seen white swans might assume that all swans are white. A single black swan disproves this supposed certainty.
For traders this means: even a long backtest and many successful trades do not prove that all relevant risks are already known. Incidentally, a black swan does not have to be negative. A surprising development with enormous positive consequences can also fall under the term. This article focuses on market shocks.
Not every black swan is a crash. Nassim Taleb stresses that a black swan can also be positive. Only three things matter: the event lies outside what was thought possible, it has an extreme impact, and in hindsight it is explained as if it had been predictable. Whether it turns out well or badly often depends on your own position. Taleb compares this to a turkey: for the turkey, Thanksgiving is a black swan; for the butcher it is not. On the stock market, a sudden upward price jump can be a stroke of luck for long positions and a heavy loss for short sellers. The Swiss franc shock of 2015 was exactly the same: those positioned against the franc suffered huge losses, while those holding francs made profits overnight.
Major events of the last 50 years
1. Black Monday on 19 October 1987
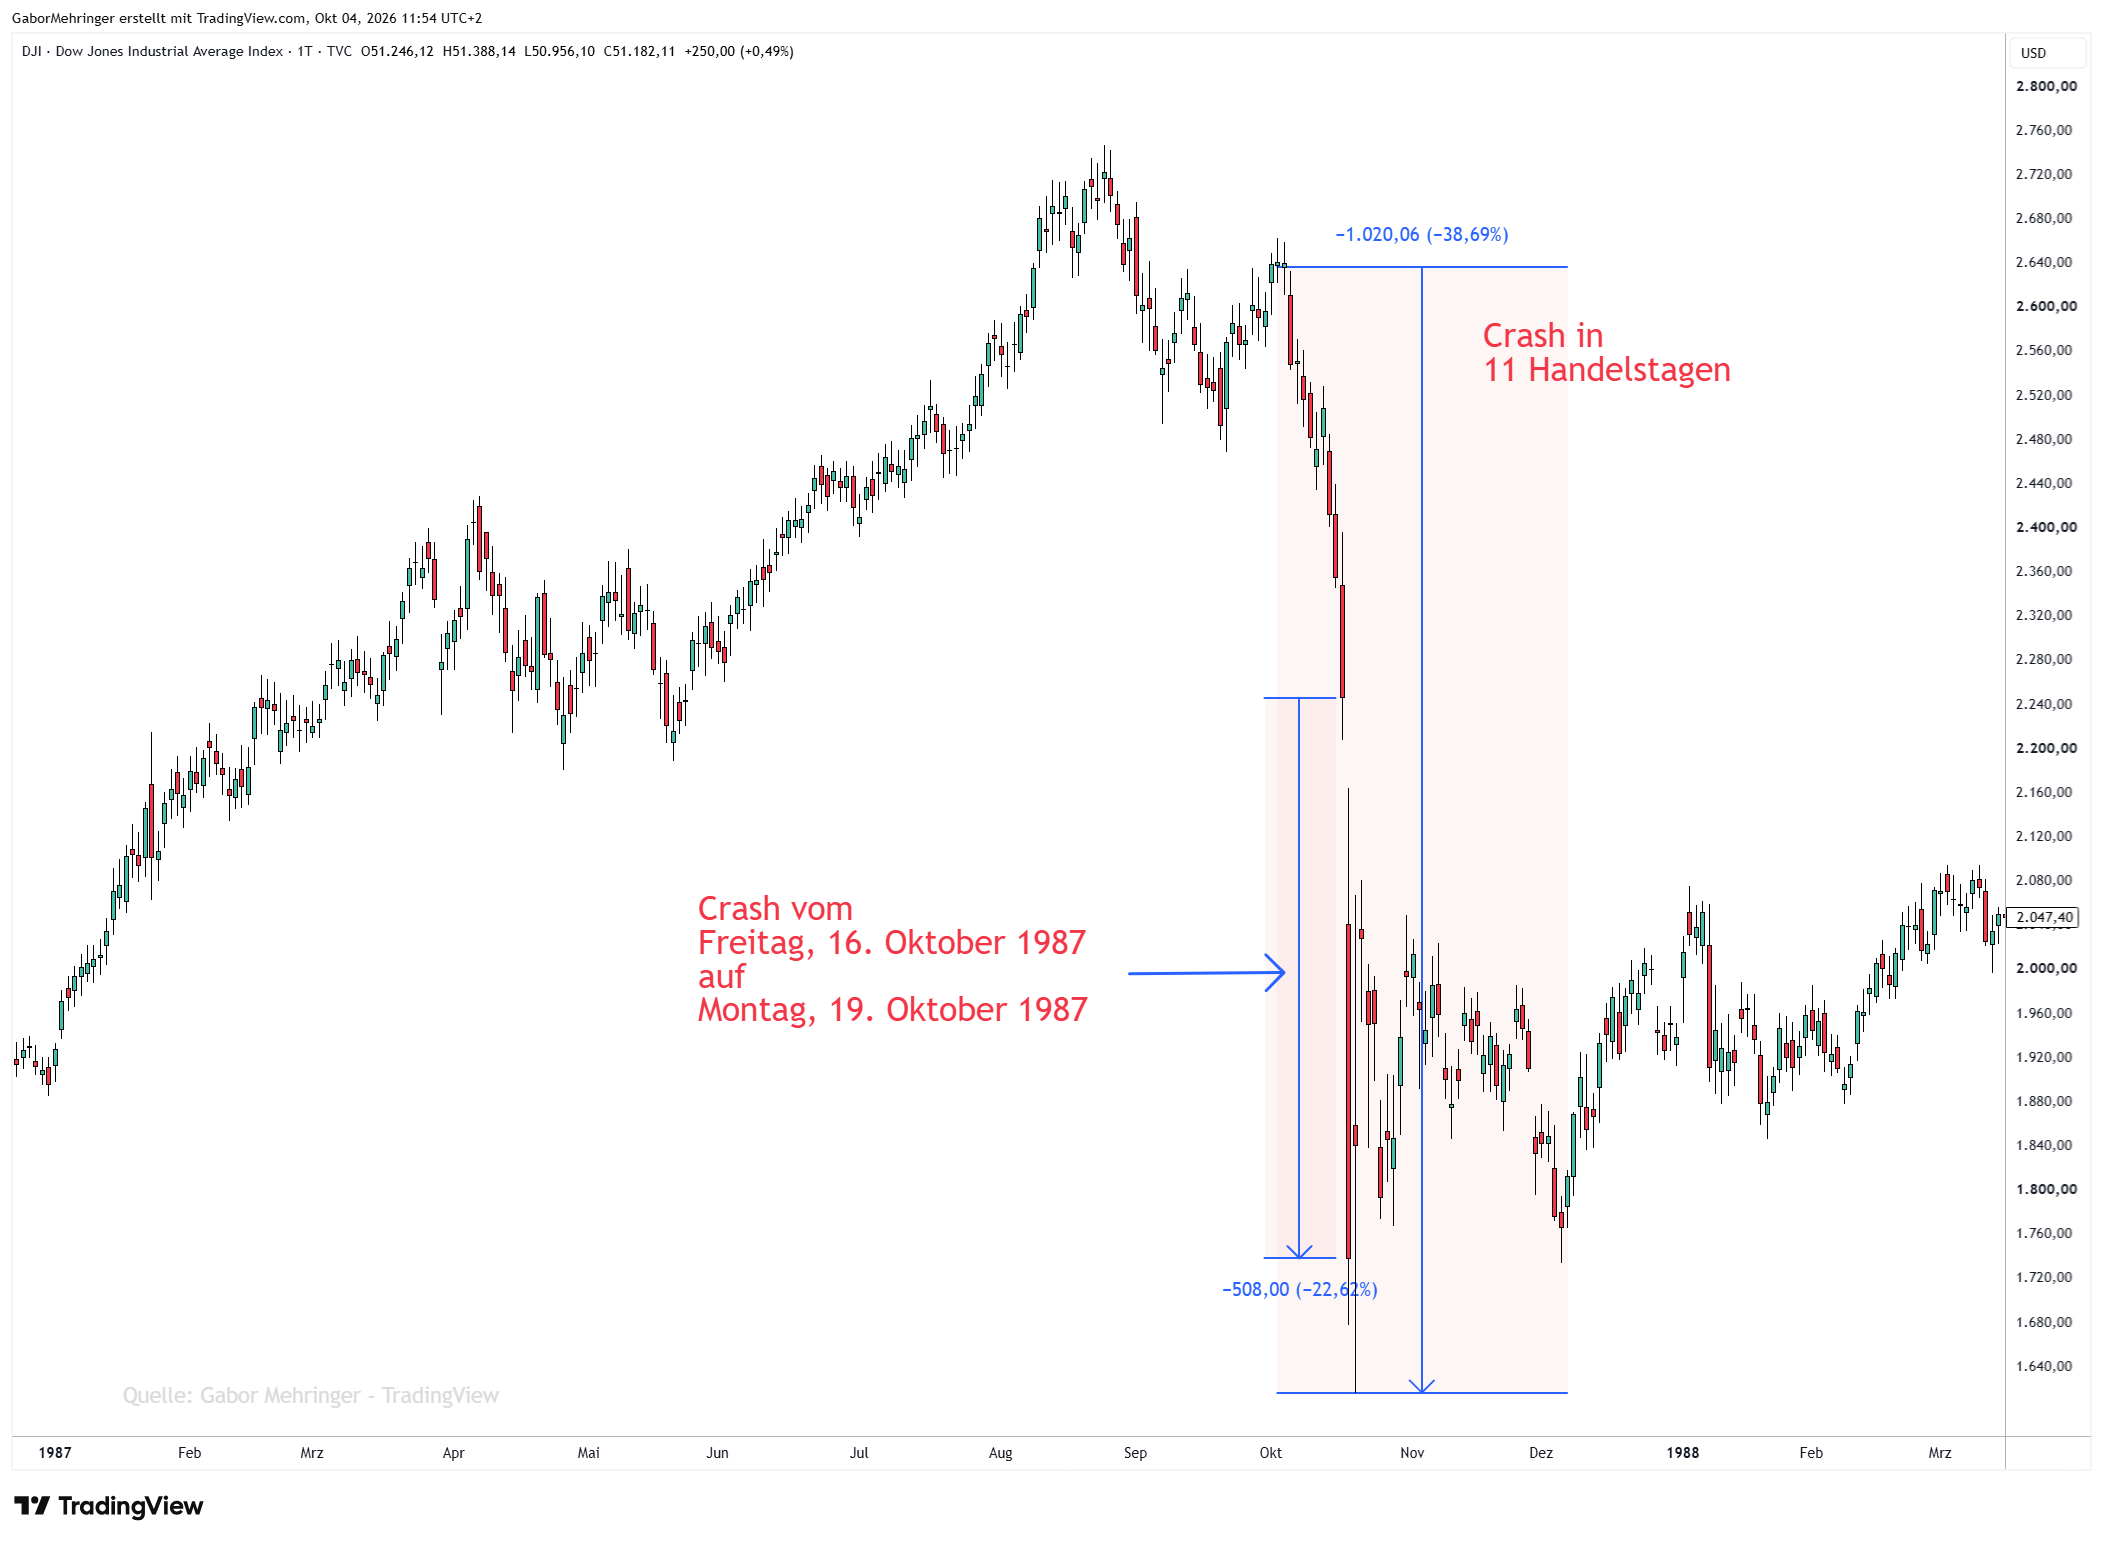
Black Monday on 19 October 1987 brought the largest percentage daily loss in the history of the Dow Jones. In a single trading day, the Dow Jones Industrial Average lost 508 points or 22.61 % of its value. At today’s index level of around 51,000 points, that would correspond to a crash of more than 11,000 points in one day.
Expand the whole section
The context: boom, rising interest rates and new financial technology
- Five-year bull market: Between 1982 and late summer 1987, the Dow Jones had more than tripled. The market was considered overheated and highly valued.
- Tensions in the environment: In autumn 1987, inflation and market interest rates rose. At the same time, the high US trade and budget deficits and a currency dispute with Germany weighed on the market: Treasury Secretary James Baker hinted publicly that he would accept a weaker US dollar.
- The seed of risk, “portfolio insurance”: Large pension funds and investment funds used a then new, computer-based hedging strategy. If share prices fell below certain thresholds, programs automatically sold S&P 500 futures on the futures exchange in Chicago to hedge the share portfolio. The models’ fatal assumption: there would always be enough buyers on the other side.
How 19 October 1987 unfolded (New York time)
- The global prelude: The panic did not start on Wall Street. After significant losses in the USA the previous Friday, the Asian exchanges collapsed on Monday. Hong Kong lost around 11 %, closed the exchange for the rest of the week and plunged by another third when it reopened. In London the market fell by around 10 %; there, a severe storm over southern England had already disrupted trading on the Friday.
- 09:30, the opening at the NYSE: A flood of sell orders was waiting at the open. For many blue chips, including IBM, the specialists on the floor were initially unable to set opening prices because there were hardly any bids.
- Morning, the feedback loop: Because shares on the NYSE were falling or could not be traded at all, the portfolio insurance programs dumped huge quantities of futures on the market in Chicago. The futures market traded at large discounts to the cash market. Arbitrageurs bought futures and sold the shares against them on the NYSE, which increased the pressure on the floor even further.
- Afternoon, the technology can no longer keep up: The NYSE order system was overwhelmed by the flood of orders, and the ticker at times lagged more than an hour behind. Many traders no longer knew at what price they were actually trading and withdrew.
- Last trading hour, capitulation: The remaining buyers gave up. The Dow Jones closed at 1,738.74 points, down 22.61 %, on record volume of around 600 million shares traded.
What made the crash so special
- No single fundamental shock: There was no outbreak of war, no collapse of a major bank and no natural disaster the weekend before. The crash is regarded as the first major failure of market structure and trading technology.
- Overwhelmed specialists: The system of New York exchange specialists relied on them dampening price swings with their own capital. Against the sheer size of the institutional sell programs, this capital was not enough.
The rescue and the consequences
- The Fed as lender of last resort: On Tuesday morning, 20 October, the Federal Reserve under its recently appointed chairman Alan Greenspan issued a one-sentence statement: it affirmed its readiness to serve as a source of liquidity to support the economic and financial system. The Fed supplied the money market with liquidity to secure the solvency of brokers and banks.
- Birth of the “circuit breaker”: Following the investigation by the Brady Commission, the US exchanges introduced mandatory trading halts for the first time. Today: if the S&P 500 falls by 7 % or 13 %, trading is halted for 15 minutes; at 20 % it ends for the rest of the day.
- The end of portfolio insurance in this form: The idea that huge fortunes could be hedged fully automatically via futures without the size of the sales shaking the market itself had been disproved.
- A surprisingly robust economy: Unlike 1929, the 1987 shock did not lead to a global economic crisis. The US economy kept growing, and the Dow Jones had recovered its losses just under two years later, in August 1989.
Assessment: A classic example of an extreme market shock. The timing and scale came as a surprise, even though there had been strains and price declines beforehand.
Lesson: Historically normal daily fluctuations are not a ceiling for possible losses.
2. Terrorist attacks on 11 September 2001
The terrorist attacks of 11 September 2001 were one of the most severe external shocks the modern financial infrastructure has ever experienced. Unlike speculative bubbles or failures of trading technology, the event struck the heart of the US financial district in Lower Manhattan directly.
Expand the whole section
The context: weakened markets meet physical destruction
- Background: In late summer 2001, after the bursting of the dotcom bubble, the US economy was already in recession and the stock markets in a bear market.
- Geographical vulnerability: The World Trade Center and the surrounding buildings housed important hubs of the financial world, including major banks, leading US Treasury dealers such as Cantor Fitzgerald, telecommunications lines and settlement offices.
- Collapse of the infrastructure: The collapse of the buildings cut power, telephone and data lines to the New York exchanges. Among the victims were many hundreds of employees of financial firms.
How it unfolded: trading halt and reopening (New York time, six hours later in Vienna)
- 11 September 2001, 08:46 and 09:03: The planes hit the World Trade Center shortly before the regular opening of the New York stock exchanges at 09:30. The start of trading on the NYSE and Nasdaq is cancelled. The European exchanges, which had already opened, plunge during the day; the DAX loses around 8.5 %.
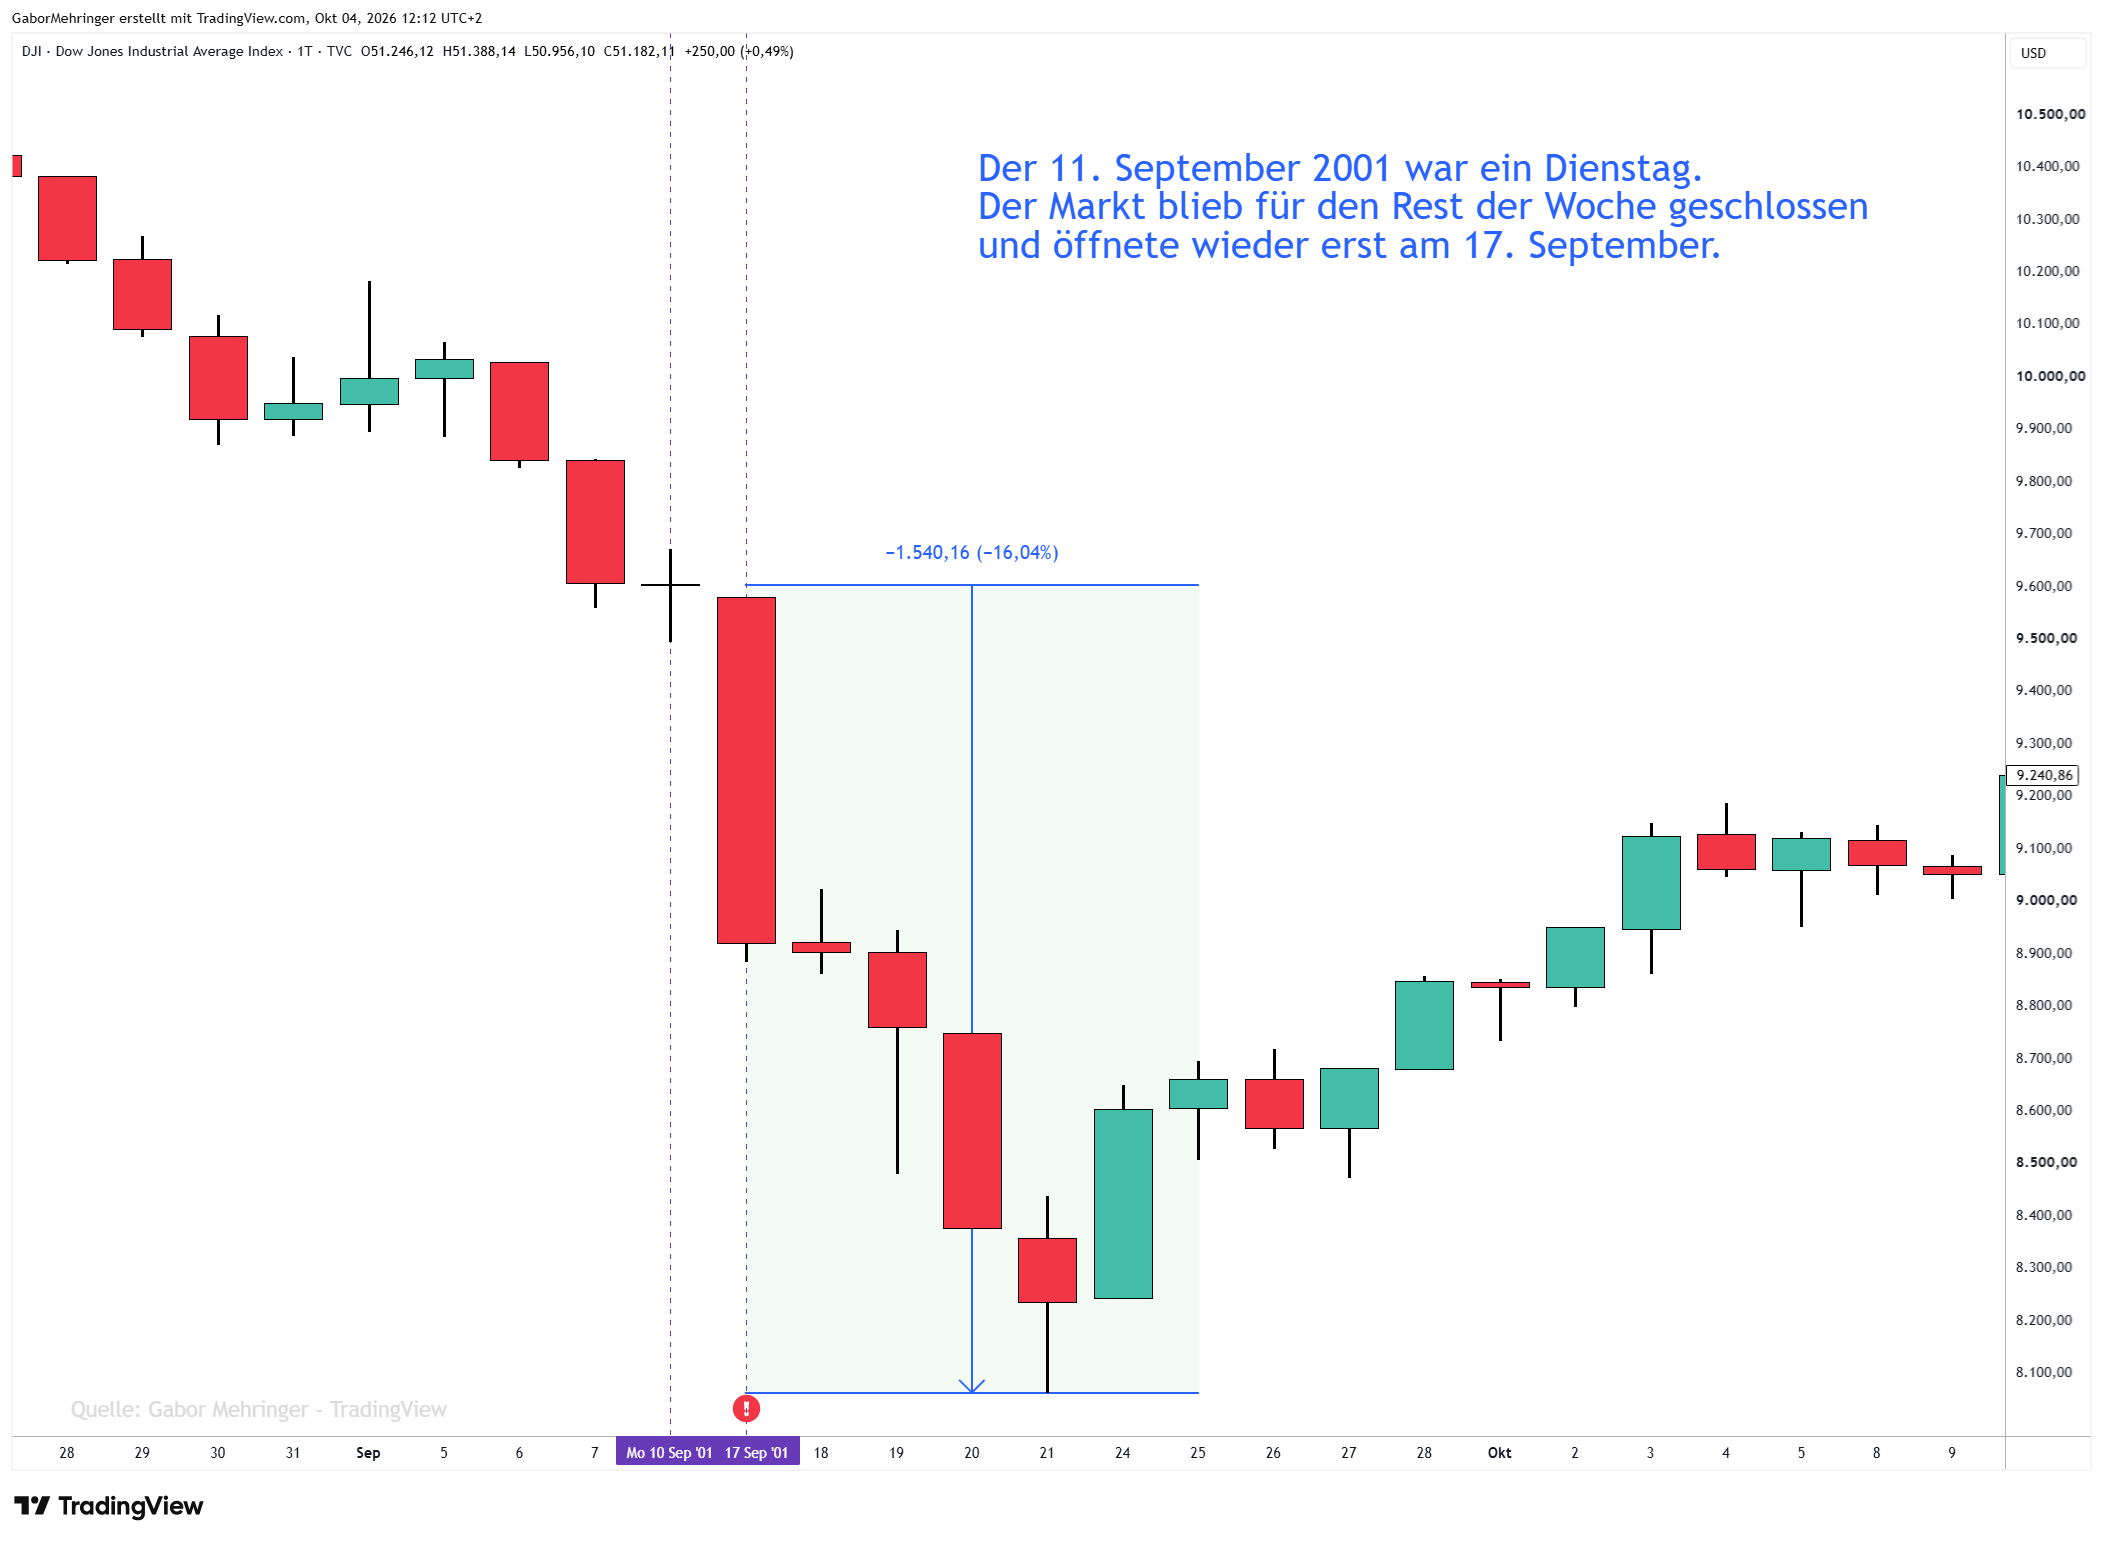
- Four days of standstill: The US stock markets remain closed for four trading days, the longest closure since 1933. Priority is given to restoring the data lines, backup data centres and settlement systems.
- 17 September 2001, the reopening: After moments of silence on the floor, Wall Street opens under tight security. Before trading begins, the US Federal Reserve cuts its key rate by half a percentage point and supplies the banking system with liquidity on a large scale.
- The first trading day: The Dow Jones loses 684.81 points or 7.13 %, the largest point loss in a single day up to that time.
- The weekly balance: By Friday, 21 September, the Dow Jones loses 14.3 % and the S&P 500 11.6 %. Around 1.4 trillion US dollars of market value is wiped out on Wall Street in five days.
How individual sectors reacted
| Sector | Price reaction and impact |
|---|---|
| Airlines | Price slumps of 30 to 50 % in the first week and fewer passengers for months; the US Congress passed a bailout package. |
| Insurers | Heavy losses from the most expensive claim in history up to that time, with estimated payouts of around 40 billion US dollars. |
| Tourism and hotels | A sharp drop in demand worldwide; travel stocks suffered for many quarters. |
| Defence and security | Counter-trend: shares of defence groups such as Lockheed Martin and Raytheon rose by double digits after the reopening. |
| Gold and US Treasuries | Flight to safe havens: gold rose significantly and bond yields fell sharply. |
The recovery and the consequences
- Rapid price recovery: Unlike the drawn-out dotcom bear market, the major indices made up the immediate losses surprisingly quickly: within one to two months, the S&P 500 and Dow Jones were back at their pre-attack levels.
- Geopolitical course-setting: The long-term consequences were political: the “war on terror”, the wars in Afghanistan and Iraq and sharply rising security spending shaped US budgets and world politics for many years.
- Backup data centres: The disaster prompted financial institutions worldwide to restructure their IT. Since then, business-critical systems have been mirrored in geographically separate data centres, and business continuity plans have become standard.
Assessment: A frequently cited example of a black swan from the point of view of many market participants. The general risk of terrorism was known, but the specific chain of events came as a massive surprise.
Lesson: Market and operational risks can occur at the same time.
3. Flash crash on 6 May 2010
The flash crash of 6 May 2010 is one of the best-known algorithmic shocks in the history of modern securities markets. Within around 36 minutes, the US stock market lost almost one trillion US dollars in market capitalisation and recovered most of the loss just as quickly. The joint report by the SEC and CFTC later examined the interplay of selling pressure, automated trading and declining liquidity.
Expand the whole section
The context: a vulnerable market in a tense situation
- Tense market sentiment: On 6 May 2010 the world’s stock markets were already very nervous about the escalating sovereign debt crisis in Greece, with protests in Athens and concerns about the cohesion of the eurozone.
- Structural change: The US exchange landscape had changed dramatically in the preceding years: away from traditional floor trading towards highly fragmented, computer-driven trading venues with dozens of exchanges and off-exchange platforms.
- The illusion of liquidity: Much of the visible trading volume did not come from long-term investors but from high-frequency traders whose algorithms place and cancel orders within milliseconds.
How 6 May 2010 unfolded (New York time, six hours later in Vienna)
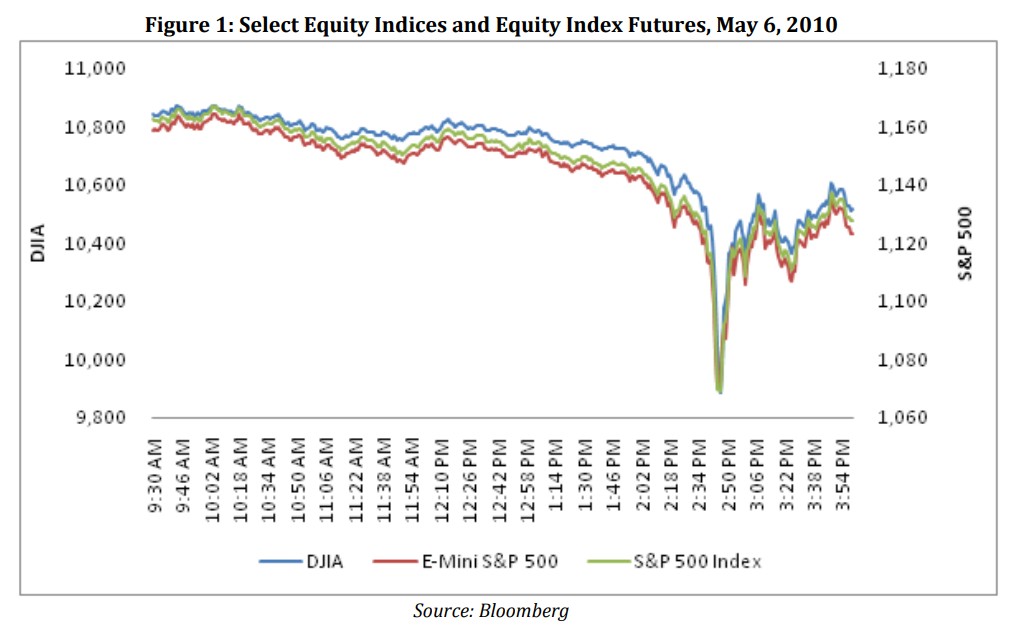
- 14:32, the trigger: A large fund company, named in media reports as Waddell & Reed, starts a sell order for 75,000 E-mini S&P 500 futures worth around 4.1 billion US dollars as a hedge. An automated algorithm is to feed the position into the market depending on trading volume, regardless of price and time.
- 14:41 to 14:44, the snowball effect: High-frequency traders and automated market makers initially absorb the sales but immediately try to pass on their risk. They trade the futures back and forth among themselves at high speed, the so-called hot-potato phase. Because the sell algorithm reacts to the rising volume with even faster sales, a feedback loop develops.
- Around 14:45, the liquidity vacuum: Many high-frequency traders withdraw from the market. The bid side of the order book collapses and the E-mini S&P 500 drops like a stone. At its low, the Dow Jones Industrial Average is down almost 1,000 points or around 9 %.
- 14:45:28, the low and automatic trading halt: The CME futures exchange activates its safety mechanism (“Stop Logic”): trading in the E-mini futures is halted for five seconds.
- Afterwards, the V-shaped recovery: The short pause is enough for buy orders to come back into the market. Within around a quarter of an hour, the Dow Jones recovers several hundred points. It ends the day clearly down at −3.2 %, but far from its low.
Absurdities and collateral damage
- The phenomenon of “stub quotes”: Market makers were obliged to quote prices continuously and kept placeholder bids far away from the market in the order book for this purpose. When real liquidity disappeared, orders were executed against these sham bids: Accenture’s share briefly fell from around 40 US dollars to one cent, Procter & Gamble temporarily lost more than a third, and other stocks such as Apple or Sotheby’s were at times traded at 100,000 US dollars per share.
- Around 20,000 trades cancelled: Afterwards, the exchange operators cancelled trades that deviated more than 60 % from the reference price before the crash.
- The case of Navinder Sarao (“Hound of Hounslow”): Years later, the US authorities took action against a British day trader who, from his parents’ house near London, had used a spoofing program to place masses of sell orders in the E-mini and cancel them immediately. He was accused of having helped increase the selling pressure that afternoon; how large his share was is disputed.
Regulatory consequences
- Limit Up / Limit Down (LULD): Dynamic price bands were introduced for individual shares. If a price leaves the band, usually 5 to 10 % around the average price of the last five minutes depending on the share, trading in that share is automatically paused.
- Market-wide trading halts: The emergency brakes for the market as a whole were revised and have since been based on the S&P 500, with thresholds at losses of 7 %, 13 % and 20 %.
- Ban on stub quotes: Market makers may no longer quote placeholder prices such as 0.01 US dollars but must quote within realistic ranges.
Assessment: A sudden shock to market mechanics; whether it counts as a black swan depends on the perspective taken.
Lesson: A liquid market can lose its capacity to absorb orders in the short term.
4. Swiss franc shock on 15 January 2015
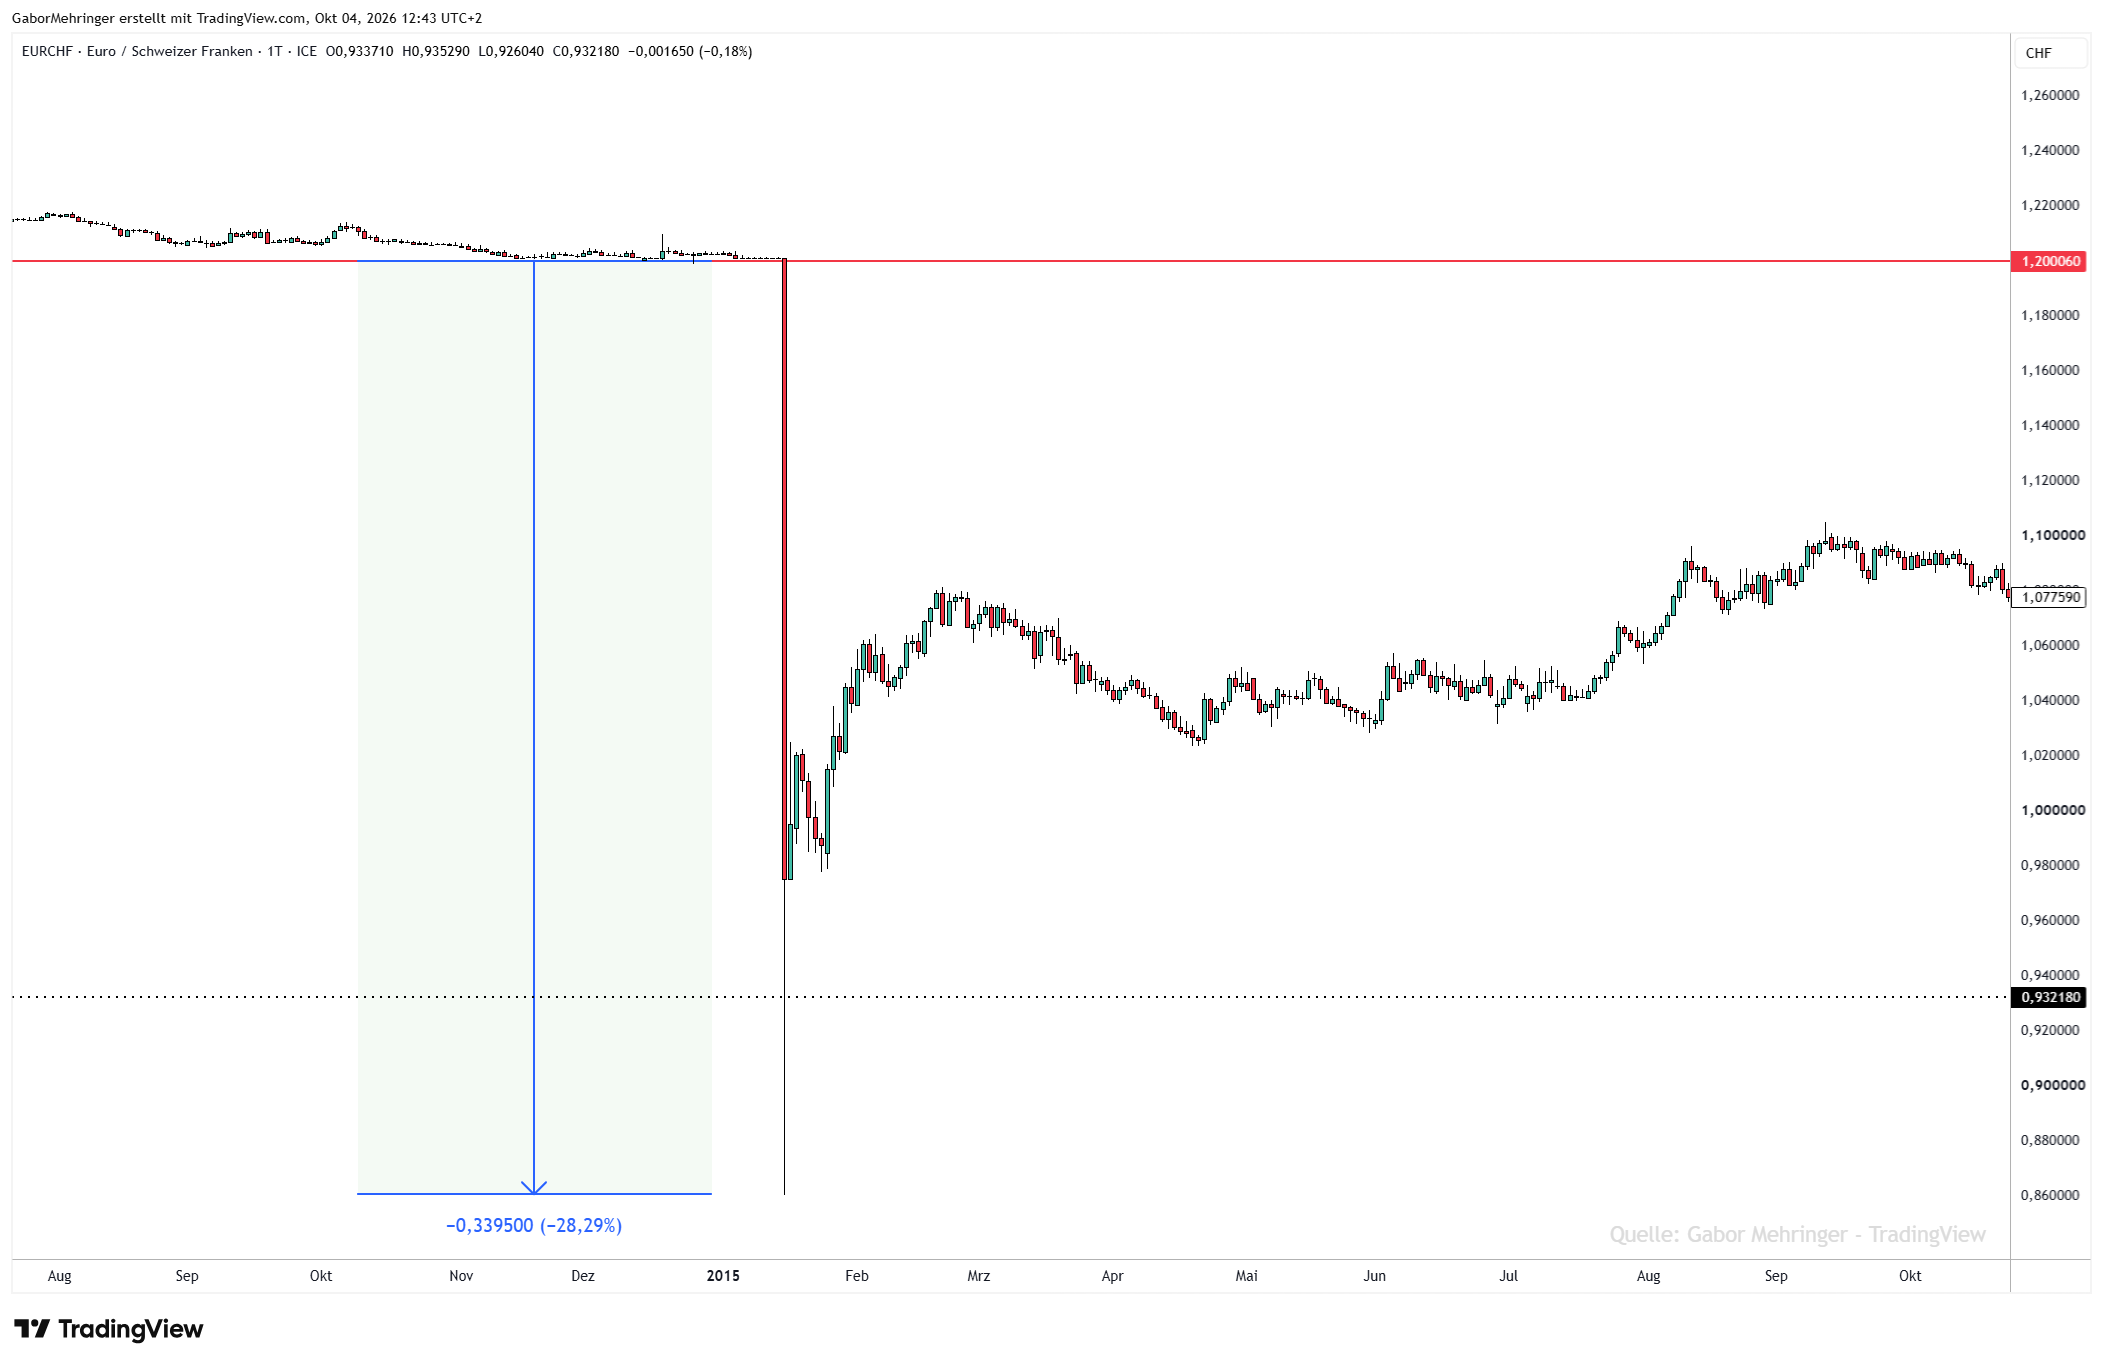
The so-called Swiss franc shock of 15 January 2015 is considered one of the most violent liquidity and volatility crashes in the history of modern currency markets. In one of the world’s most traded currencies, price moves occurred within minutes that were considered statistically practically impossible.
Expand the whole section
The context: the artificial floor of 1.20
- September 2011: In the middle of the euro debt crisis, investors worldwide fled into the safe haven of the Swiss franc. To prevent a ruinous appreciation for the Swiss export economy and tourism, the Swiss National Bank (SNB) introduced a minimum exchange rate of 1.20 francs per euro.
- The promise: The SNB announced that it would defend this rate “with the utmost determination” and with unlimited currency purchases. For years, traders and banks regarded the 1.20 level as unshakeable.
- The breaking point: At the end of 2014 it became clear that the European Central Bank (ECB) would launch a huge bond-buying programme worth over 1,000 billion euros. To hold the minimum rate against this flood of euros, the SNB would have had to inflate its balance sheet with further currency purchases running into the hundreds of billions.
How 15 January 2015 unfolded (Zurich time)
- 10:29, the deceptive calm: EUR/CHF is trading as usual just above the floor at around 1.2010.
- 10:30, the decision: Without warning, the SNB announces that it is abandoning the minimum rate of 1.20 francs per euro. At the same time, it cuts its key rate deeper into negative territory to −0.75 %.
- 10:31 to 10:35, the liquidity vacuum: The banks’ electronic order books empty abruptly. Nobody wants to buy euros against francs any more. Banks and market makers withdraw their prices; for several minutes there is practically no bid side.
- 10:35 to 10:50, free fall: Because there are no buyers in the market, stop-loss orders find nothing to execute against. The rate breaks through parity (1.00) and plunges at its worst to around 0.85 francs. That is a drop of almost 30 % in one of the major currencies within around 20 minutes.
- From 11:00, tentative stabilisation: The first major banks provide liquidity again. In the afternoon the rate settles in the range of 0.98 to 1.02 francs, close to parity.
The consequences
- The failure of stop-loss orders: Many traders had placed their stop-loss just below 1.20, for example at 1.1995. Because there were no buyers there, the orders were only executed at prices around 1.02 or lower. That is massive negative slippage.
- Broker bankruptcies: Several forex brokers for retail clients became insolvent, including Alpari UK, which announced its insolvency the very next day. Others, such as the industry giant FXCM, suffered losses running into hundreds of millions and had to be rescued with an emergency loan because clients’ trading accounts had slipped deep into the red.
- Hedge fund losses: The hedge fund Everest Capital lost almost all the assets of its largest fund, around 830 million US dollars, because it had made a leveraged bet on the 1.20 level holding.
- Loss of confidence: Just a few days before the decision, the SNB had publicly reaffirmed the floor as a cornerstone of its monetary policy. The abrupt U-turn did lasting damage to the credibility of central bank commitments.
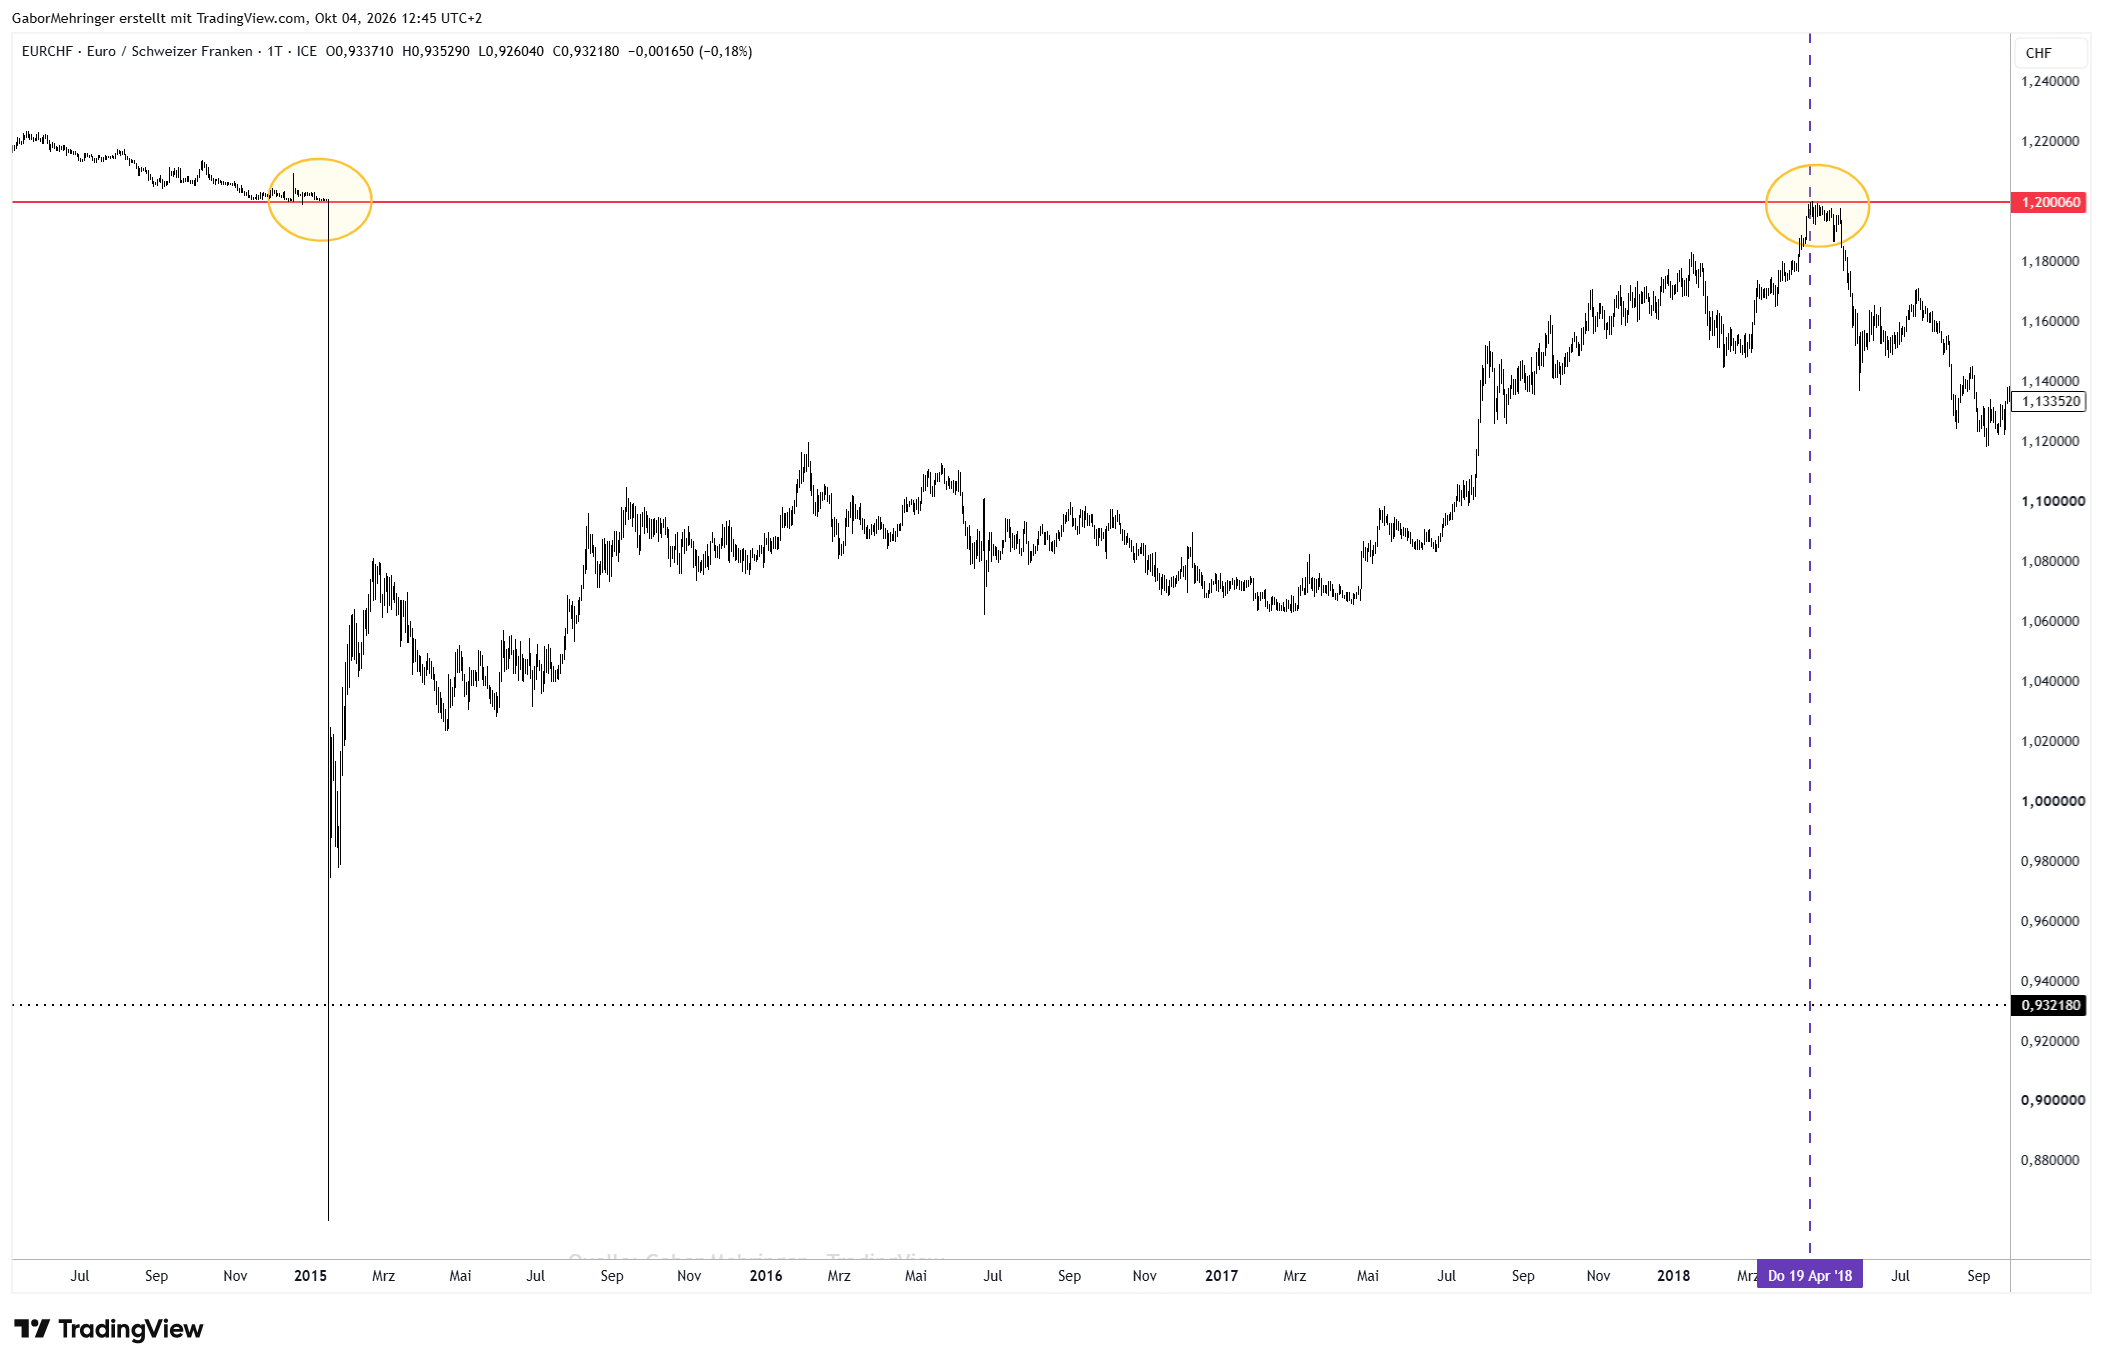
After just over three years, in April 2018, the breakdown level of 1.20 was tested again technically: the price ran up to the level from below and turned down again there.
Assessment: A particularly vivid surprise shock for currency traders. A change in monetary policy was possible in principle, but the specific step caught many market participants unprepared.
Lesson: Even a price floor defended for years is no permanent guarantee.
5. Corona crash in February and March 2020
The spread of COVID-19 and the restrictions on economic life led to a rapid international market slump.
Expand the whole section
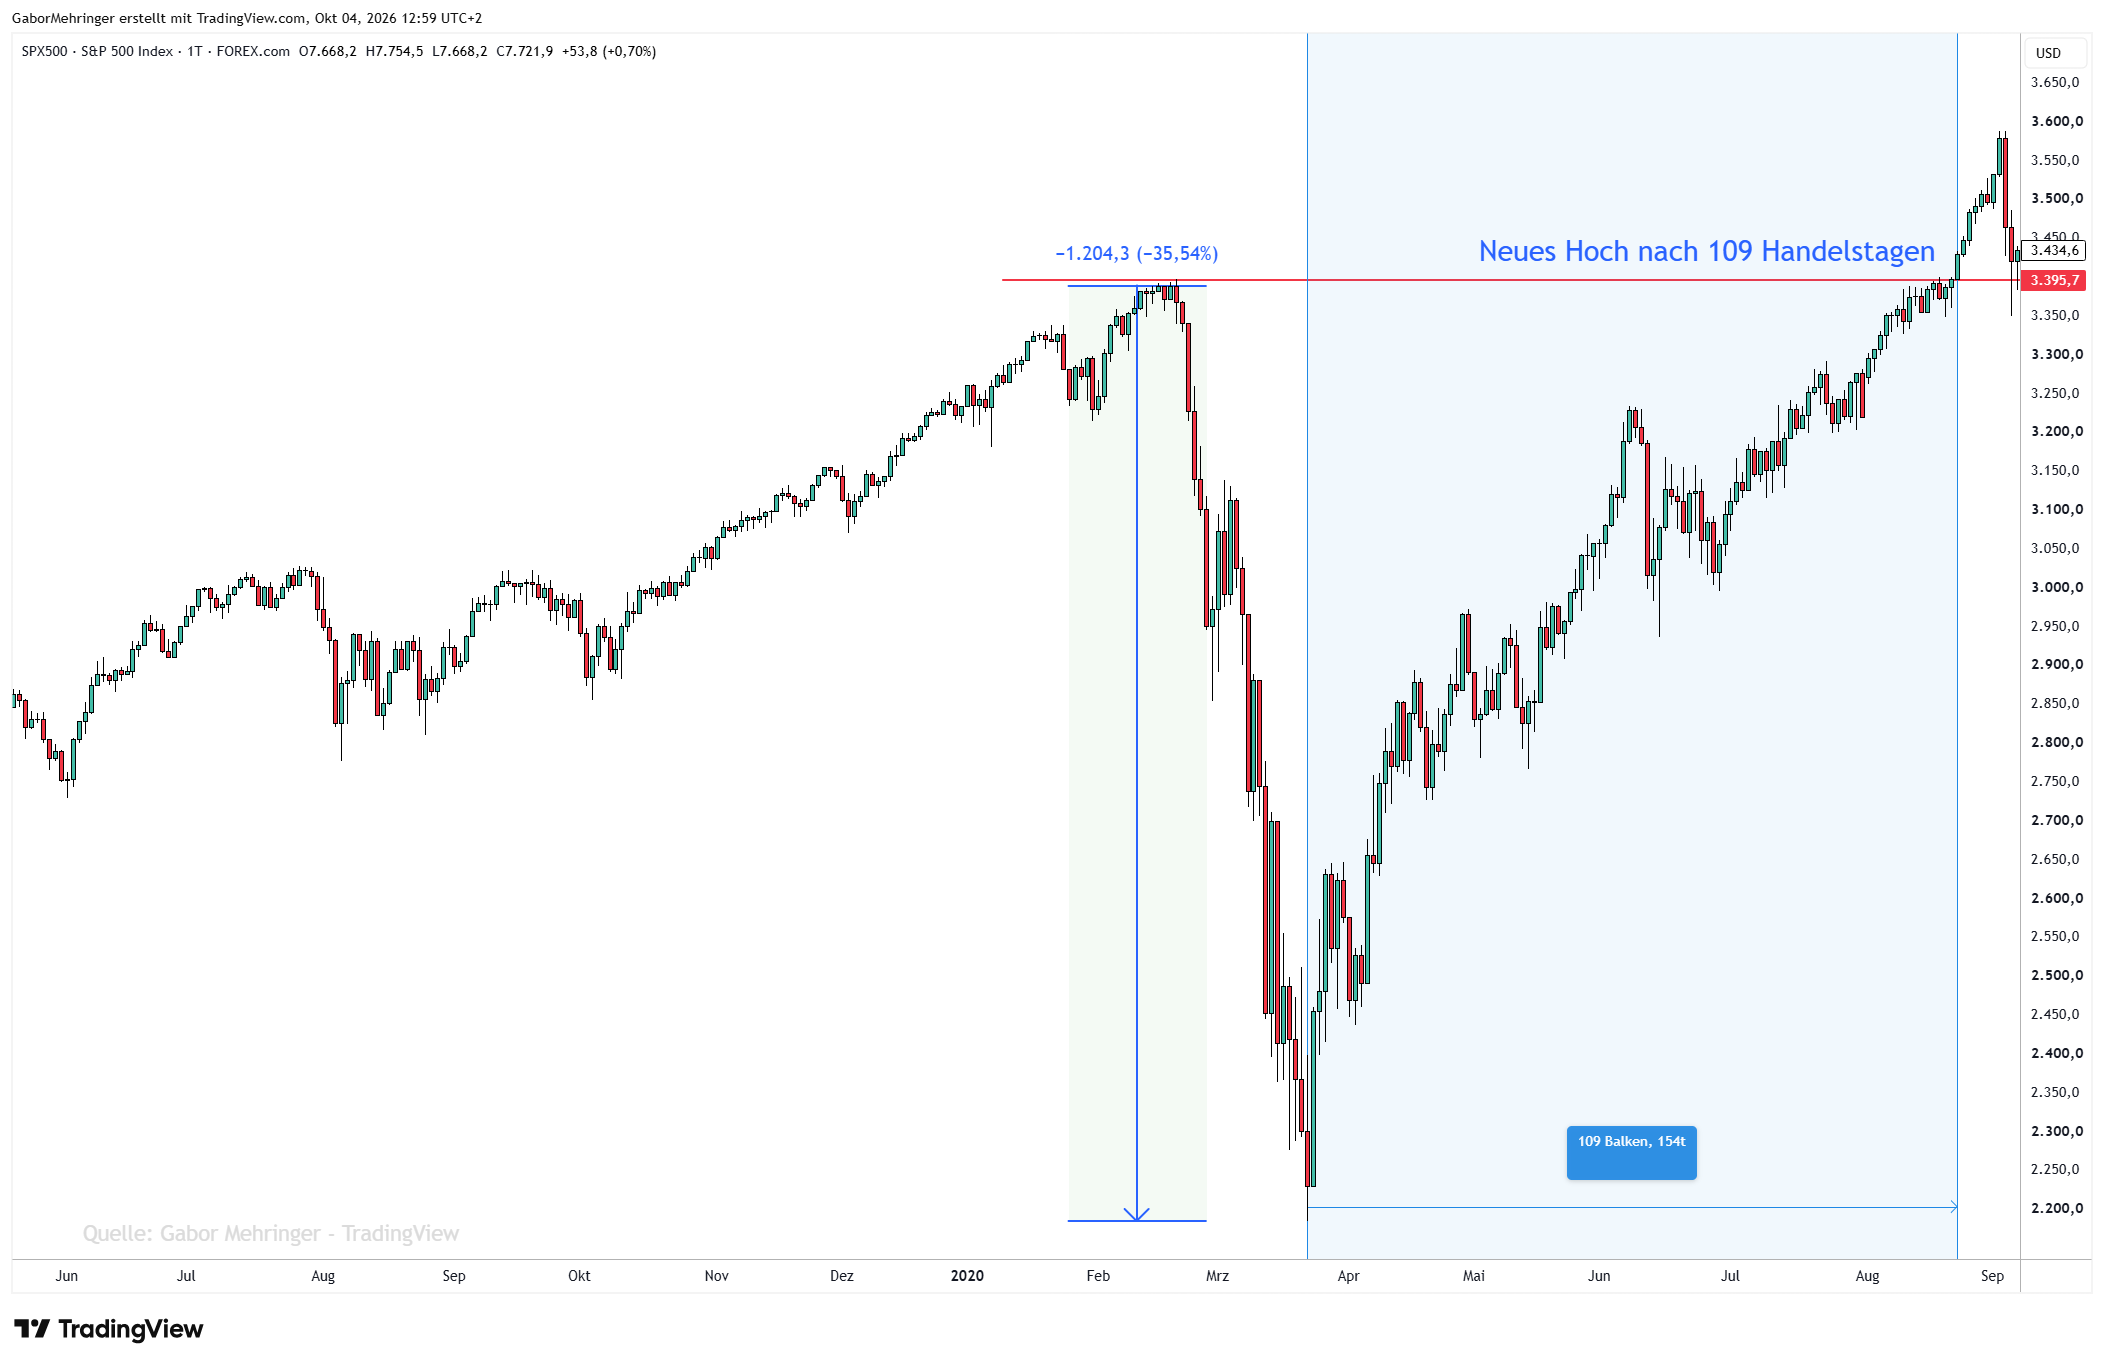
Assessment: Often called a black swan. Taleb explicitly rejected this label: pandemics were a known risk. What surprised many market participants were the specific course of events and the speed of the economic consequences.
Lesson: A risk does not have to be precisely datable for precautions to make sense.
6. Negative WTI futures prices on 20 April 2020
The crash of the May 2020 WTI crude oil future (CLK20) on 20 April 2020 was historic: for the first time, the price of the most important US oil contract fell deep into negative territory. The contract settled at minus 37.63 US dollars per barrel.
Expand the whole section
The background was the imminent expiry on 21 April combined with practically fully booked storage capacity at the Cushing hub in Oklahoma, plus demand that had collapsed in the pandemic. Financial investors who could not take physical delivery of oil had to get rid of the contract at any price, while physical buyers wanted to be paid to take the oil.
Timeline of the crash (New York time, six hours later in Vienna)
- Morning: Early in the morning the contract is still at around 10 to 11 US dollars, but comes under increasing pressure from persistent selling and falls to around 4 US dollars by midday.
- Early afternoon: After falling below the 2-dollar mark, the sell-off accelerates dramatically. Shortly after 14:00 the price breaks through zero and trades in negative territory for the first time in its history.
- Until around 14:25: There is hardly any liquidity left in the order book. The price plunges minute by minute from −10 through −20 to below −35 US dollars.
- Around 14:29: Low of the day at −40.32 US dollars per barrel.
- 14:30: The official settlement price, calculated from the trading in the last two minutes, is −37.63 US dollars per barrel.
- Afterwards: In further trading the price partly recovers but stays in negative territory that day.
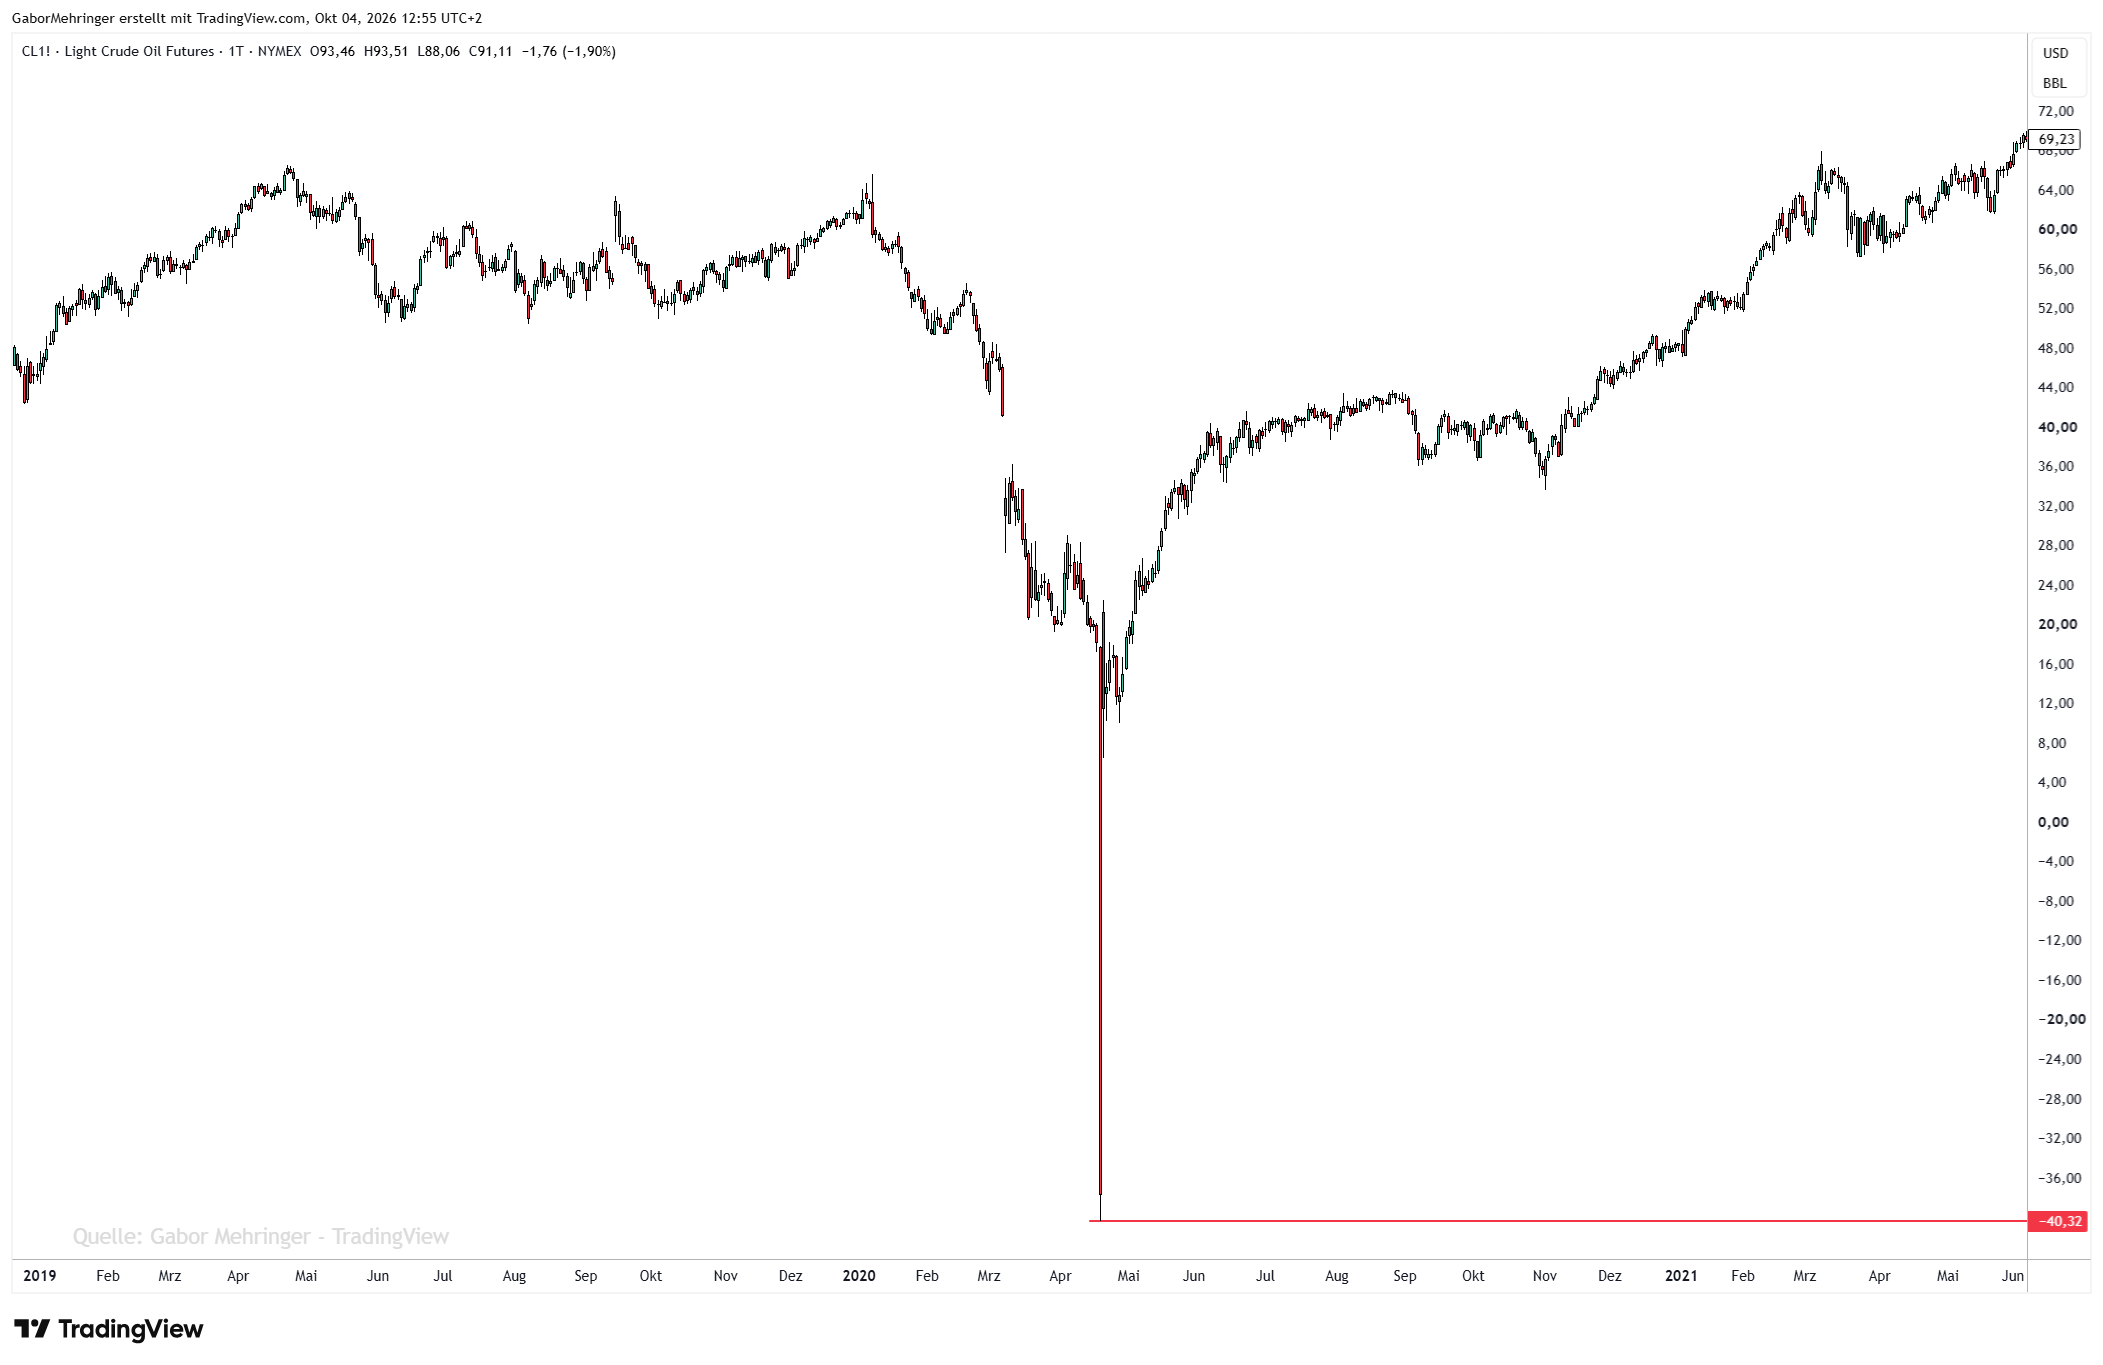
Important: this price applied to one specific futures contract. Not all oil prices or maturities turned negative at the same time.
Assessment: A historic extreme case that challenged many assumptions and technical systems. Negative prices were nevertheless not impossible in principle.
Lesson: With futures, expiry, delivery and storage are part of understanding the risk.
Why a stop-loss is not a price guarantee
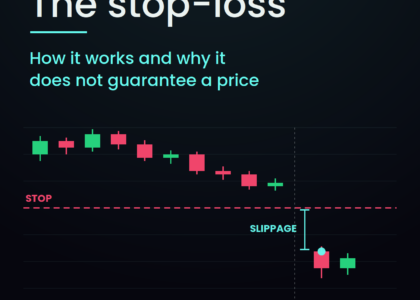
A normal stop-market order becomes a market order once triggered. It is executed at the available prices. With a price jump or a lack of liquidity, the execution can differ considerably from the stop price.
A simplified example: you plan to exit 20 points below your entry. After a surprising piece of news, however, the next executable price is 60 points lower. The actual loss can then be much larger than planned. This is a calculation example, not a depiction of a specific historical trade.
A stop-limit order limits the accepted execution price but may remain unexecuted as a result. Guaranteed stops are separate products with their own conditions and are not available everywhere.
What investors and day traders can learn from this
The following points are general principles of risk planning:
- Look at position sizes under stress too. Do not just calculate the planned stop loss, but also play through larger price gaps and worse executions.
- Assess leverage and liquidity together. High leverage makes an unfavourable execution particularly costly.
- See the overall risk. Several positions can represent the same bet. Long positions in Nasdaq futures, technology shares and a technology ETF, for example, are closely linked.
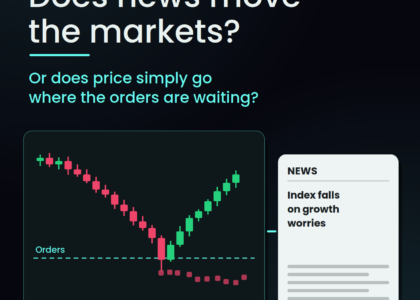
- Take news and holding period into account. An economic calendar covers scheduled events. Surprises can occur at any time; outside trading hours, price gaps can also form.
- Understand the product rules. These include expiry, margin, price limits, trading halts and, where applicable, physical delivery.
- Prepare a procedure for disruptions. How can open positions be controlled if the platform or connection fails? What contact options does the broker offer?
- Allow for trading breaks. If spreads, liquidity or technical processes do not allow reliable execution, waiting can be a well-founded decision.
Especially in M5 trading, the short holding period is not complete protection. The flash crash shows that extraordinary moves can develop within a few minutes. A chart set-up describes a trading idea. It guarantees neither a specific execution price nor that the market will function.
How big your position can be for a given risk and how much profit you need to recover after a loss, you can work out yourself with the Position size calculator and the Drawdown matrix .
Dealing with uncertainty
The black swan reminds us that experience is valuable but does not promise completeness. Markets can produce situations that are missing from the existing data.
The decisive question is therefore: how resilient is your trading when your assumptions no longer hold?
A sound approach to risk takes into account that forecasts fail, liquidity disappears and losses can be larger than planned. If you know these limits, you can make decisions more consciously – without having to predict the next shock.
This article is for financial education and does not constitute individual investment advice or a trading recommendation.
Sources
- Nassim Nicholas Taleb: The Black Swan (2007)
- Federal Reserve: 1987 stock market crash, response to 11 September
- SEC and CFTC: report on the flash crash
- Swiss National Bank: discontinuation of the minimum exchange rate
- The New Yorker: Taleb on the pandemic and black swans
- CFTC: negative WTI futures prices
- SEC Investor.gov: stop and stop-limit orders
Best wishes
Gabor